Fig. 2.
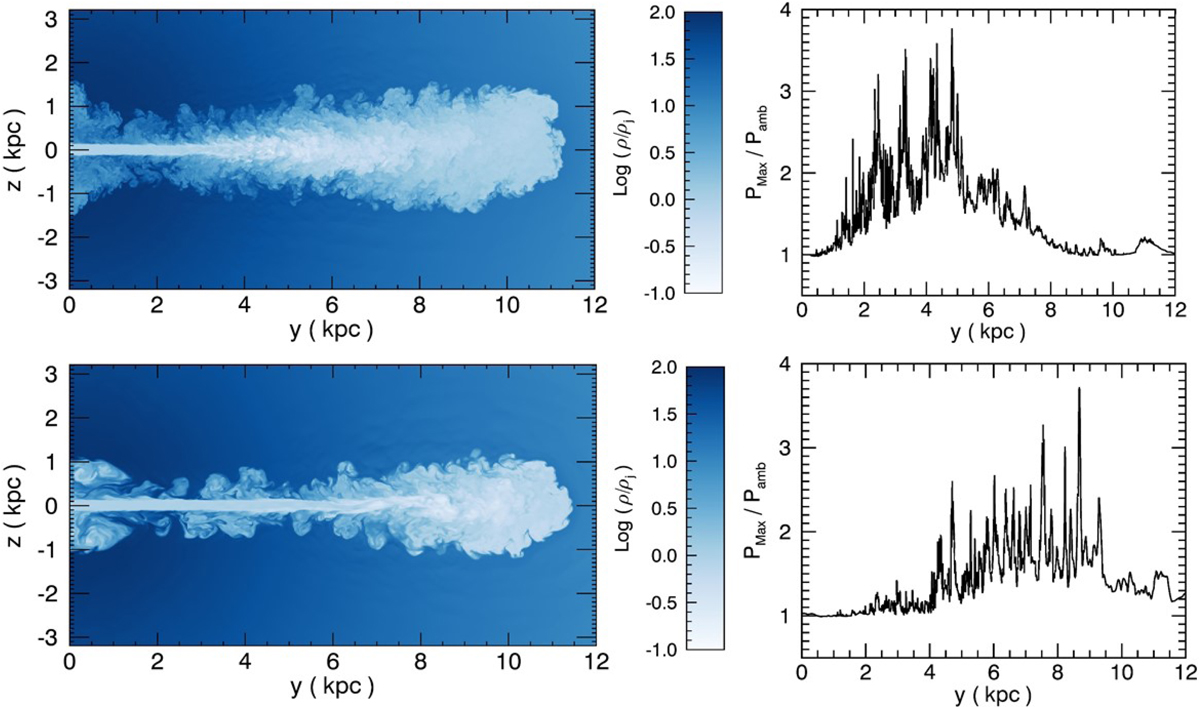
Top panels: results for the HD case B of Paper I (M = 4, η = 10−2, ℒkin = 1.1 × 1042) at t = 640 time units, 4.9 × 10⁷ yr). Left panel: cut in the (y, z) plane of the logarithmic density distribution in units of jet density. The spatial units are in jet radii (100 pc) and the image extends over 12 kpc in the jet direction and over 6.4 kpc in the transverse direction. Right panel: maximum particle pressure as a function of y. The particle pressure is plotted in units of the ambient value (instead of the computational units ![]() ). Bottom panel: as in the top panel, but for the MHD case A of the present paper and at t = 400 time units, 3.1 × 10⁷ yrs. The two cases share the same jet parameters but the second simulation includes magnetic field corresponding to β = 103.
). Bottom panel: as in the top panel, but for the MHD case A of the present paper and at t = 400 time units, 3.1 × 10⁷ yrs. The two cases share the same jet parameters but the second simulation includes magnetic field corresponding to β = 103.
Current usage metrics show cumulative count of Article Views (full-text article views including HTML views, PDF and ePub downloads, according to the available data) and Abstracts Views on Vision4Press platform.
Data correspond to usage on the plateform after 2015. The current usage metrics is available 48-96 hours after online publication and is updated daily on week days.
Initial download of the metrics may take a while.