Free Access
Fig. 1.
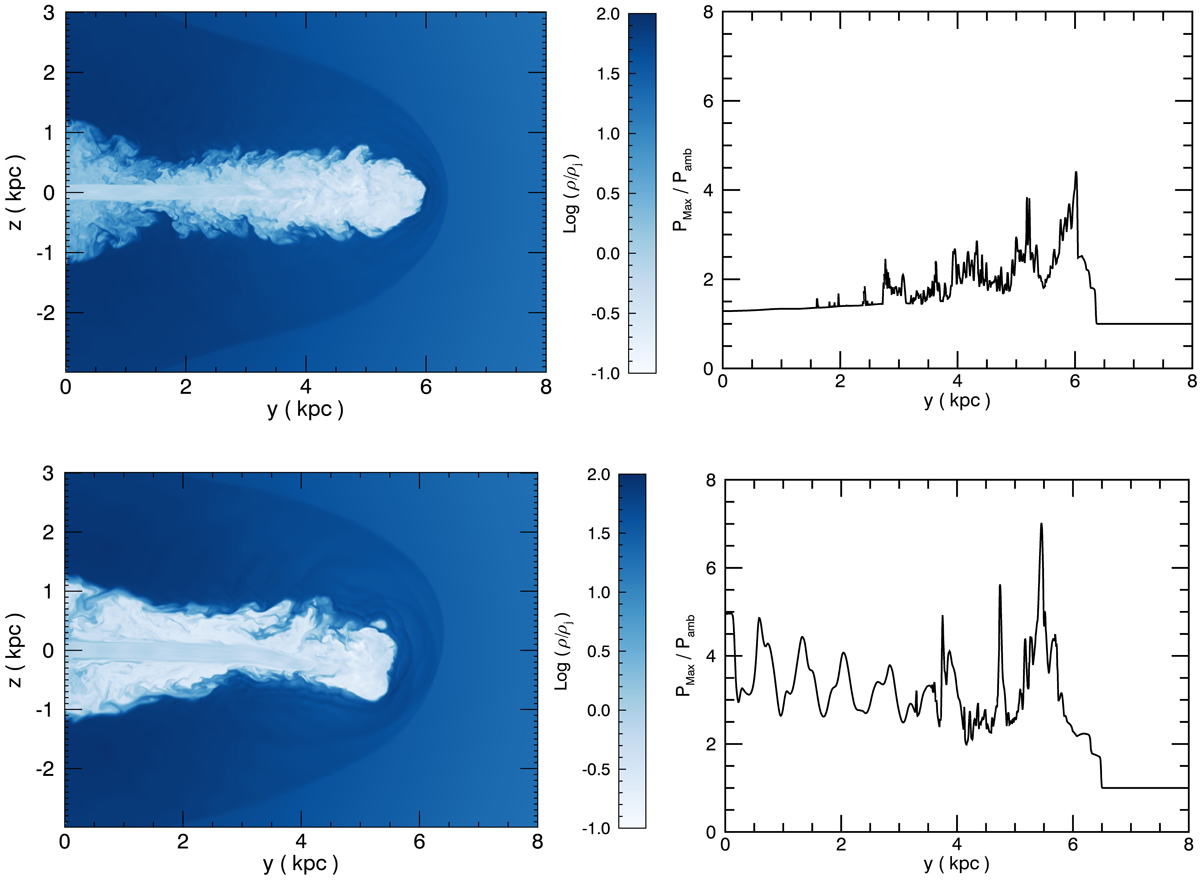
Top panels: (left) longitudinal cut of the density distribution in the (y, z) plane for the HD case B of paper I after 200 time units, t = 1.5 × 10⁷ yrs, and (right) maximum pressure as a function of y. Bottom panels: same as in top panel but for case D of the present paper.
Current usage metrics show cumulative count of Article Views (full-text article views including HTML views, PDF and ePub downloads, according to the available data) and Abstracts Views on Vision4Press platform.
Data correspond to usage on the plateform after 2015. The current usage metrics is available 48-96 hours after online publication and is updated daily on week days.
Initial download of the metrics may take a while.