Fig. 7.
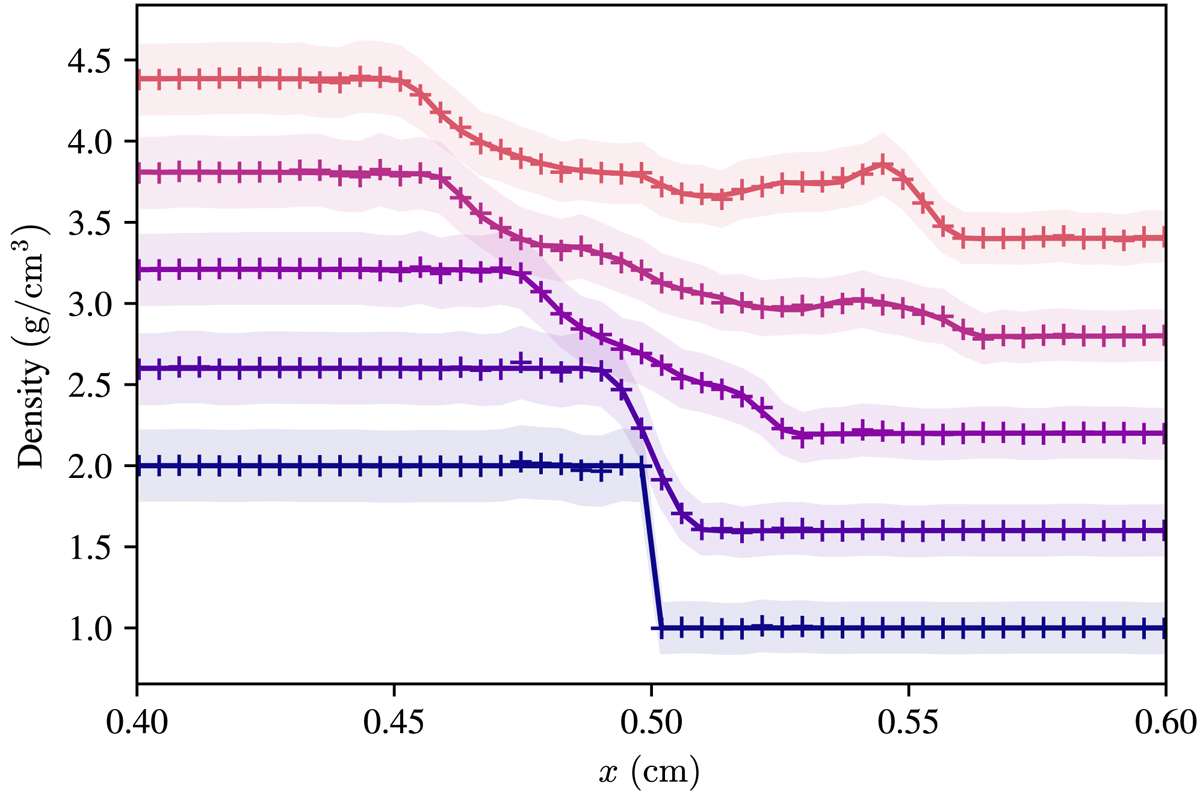
Evolution of the cross-section of the gas density (solid lines) and the gas tracer density (symbols and shaded regions) for the Kelvin–Helmoltz instability at different times (from blue to red from the start to the end of the simulation at t = 0.3 s). The profiles have been shifted vertically (each by 0.6 g cm−3) so that one may easily distinguish them from one another. The shaded regions are ±5σ, where σ has been estimated using a Poisson sampling noise. The gas tracers are accurately following the diffusion of the gas.
Current usage metrics show cumulative count of Article Views (full-text article views including HTML views, PDF and ePub downloads, according to the available data) and Abstracts Views on Vision4Press platform.
Data correspond to usage on the plateform after 2015. The current usage metrics is available 48-96 hours after online publication and is updated daily on week days.
Initial download of the metrics may take a while.