Fig. 5.
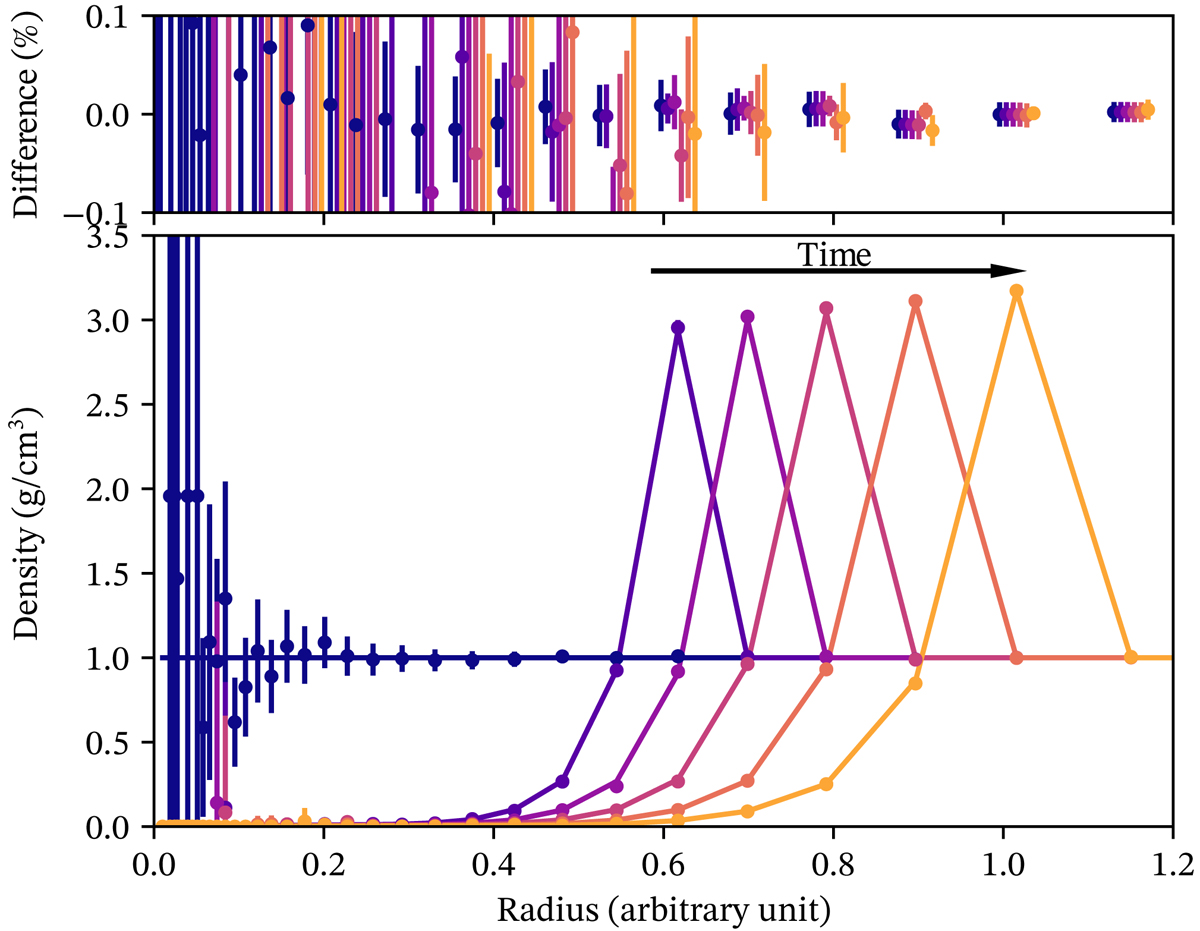
Bottom panel: radial profile at different times of a Sedov explosion (from blue to yellow) for the gas (solid lines) and the gas tracer (dots). The error bars are 2σ errors. Top panel: relative difference between the gas profile and the gas tracer profile. Data have been shifted by −0.25, −0.125, 0, 0.125 and 0.25 radius units respectively (from blue to yellow) so that one may easily distinguish the different data points. Details of the simulation are discussed in the text. The gas tracer particles are accurately advected with the gas.
Current usage metrics show cumulative count of Article Views (full-text article views including HTML views, PDF and ePub downloads, according to the available data) and Abstracts Views on Vision4Press platform.
Data correspond to usage on the plateform after 2015. The current usage metrics is available 48-96 hours after online publication and is updated daily on week days.
Initial download of the metrics may take a while.