Fig. 4.
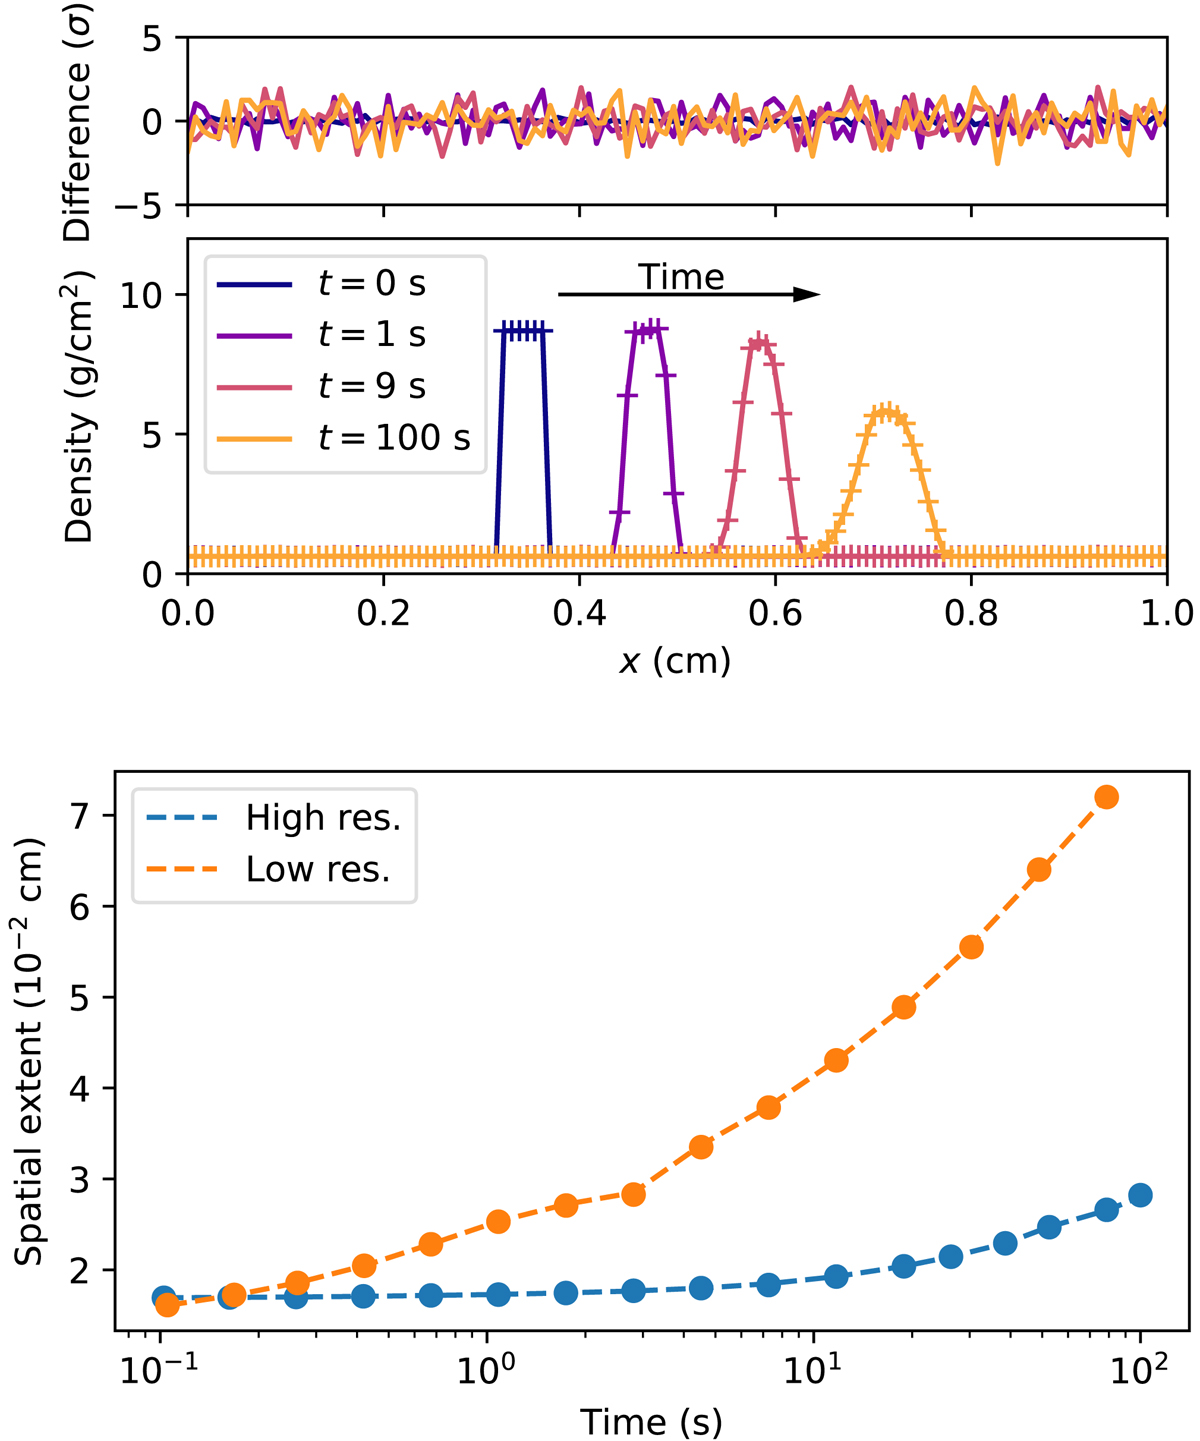
Top panel (bottom):: gas density profile (solid line) and gas density profile (plus symbols) at different times (reported in the legend). The profiles have been recentred and shifted horizontally by −0.12 cm, 0, 0.12 cm, and 0.24 cm for t = 0, 1, 9, and 100 s, respectively. Top panel (top):: relative difference between the gas and gas tracer density profiles in units of the expected noise level ![]() . Bottom panel: evolution of the spatial extent of an advected overdensity as a function of time for the gas (dashed) and the gas tracer particles (dot symbols) for a high-resolution run (blue) and a low-resolution run (orange, see text for details). The difference shows no spatial dependence. The gas tracers diffuse exactly as the gas.
. Bottom panel: evolution of the spatial extent of an advected overdensity as a function of time for the gas (dashed) and the gas tracer particles (dot symbols) for a high-resolution run (blue) and a low-resolution run (orange, see text for details). The difference shows no spatial dependence. The gas tracers diffuse exactly as the gas.
Current usage metrics show cumulative count of Article Views (full-text article views including HTML views, PDF and ePub downloads, according to the available data) and Abstracts Views on Vision4Press platform.
Data correspond to usage on the plateform after 2015. The current usage metrics is available 48-96 hours after online publication and is updated daily on week days.
Initial download of the metrics may take a while.