Fig. 17.
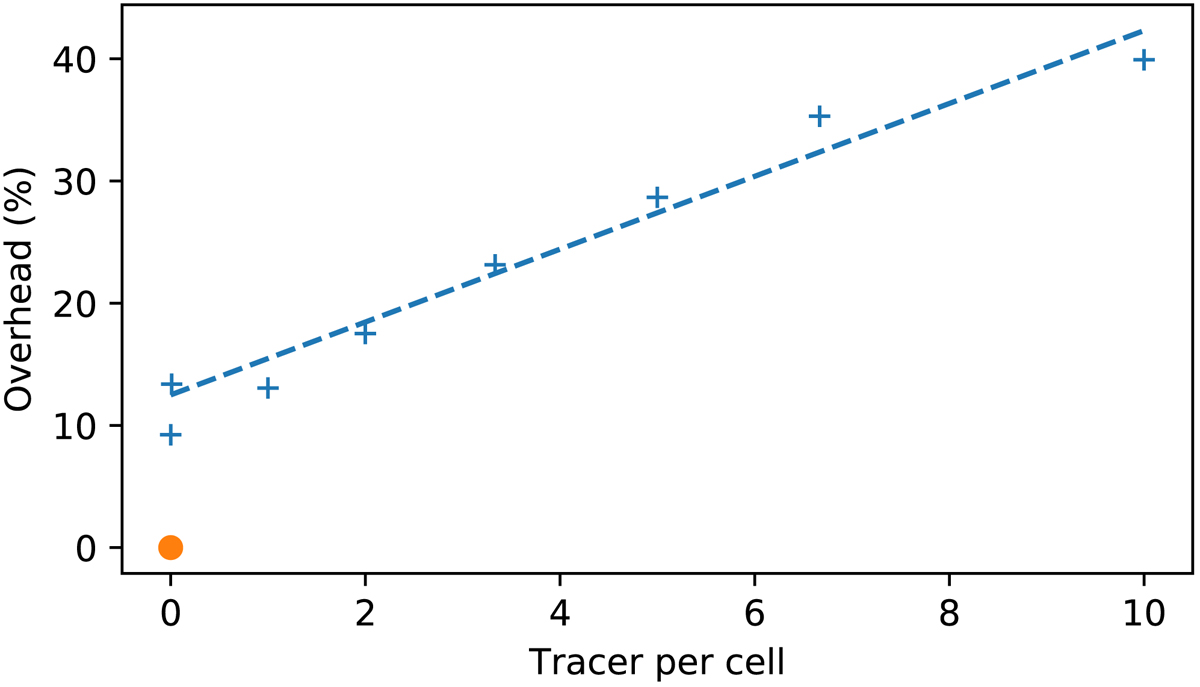
Overhead as a function of the number of tracer particles per initial cell (symbols). The orange symbol is the simulation with the tracer deactivated. The data (excluding the run with the tracer deactivated) have been fitted with a linear function (dashed line). The estimated overhead (slope of the fit) is ∼3% per tracer per initial cell with an extra constant of ∼10%.
Current usage metrics show cumulative count of Article Views (full-text article views including HTML views, PDF and ePub downloads, according to the available data) and Abstracts Views on Vision4Press platform.
Data correspond to usage on the plateform after 2015. The current usage metrics is available 48-96 hours after online publication and is updated daily on week days.
Initial download of the metrics may take a while.