Fig. 16.
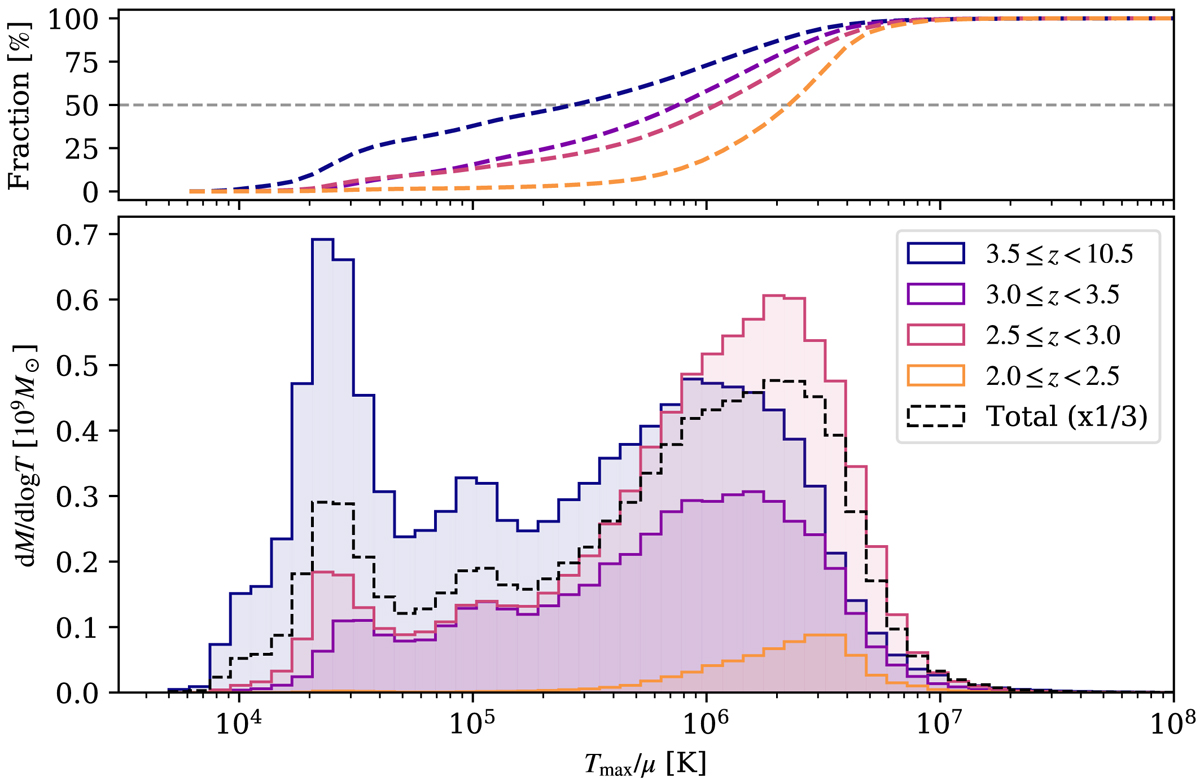
Bottom panel: histogram of the maximum temperature of the gas accreted onto the central galaxy between different redshifts (from early accretion time in blue to late accretion time in yellow). Top panel: cumulative distribution of the gas temperature. Only the gas-forming stars within the virial radius are selected. The total distribution integrated over the total accretion time is shown with the black dashed line in the bottom panel. The total distribution has been rescaled by a factor of one third for visualisation. The halo has two modes of accretion: a cold and a hot mode. At high z the cold mode dominates and at low z the hot mode dominates.
Current usage metrics show cumulative count of Article Views (full-text article views including HTML views, PDF and ePub downloads, according to the available data) and Abstracts Views on Vision4Press platform.
Data correspond to usage on the plateform after 2015. The current usage metrics is available 48-96 hours after online publication and is updated daily on week days.
Initial download of the metrics may take a while.