Fig. 14.
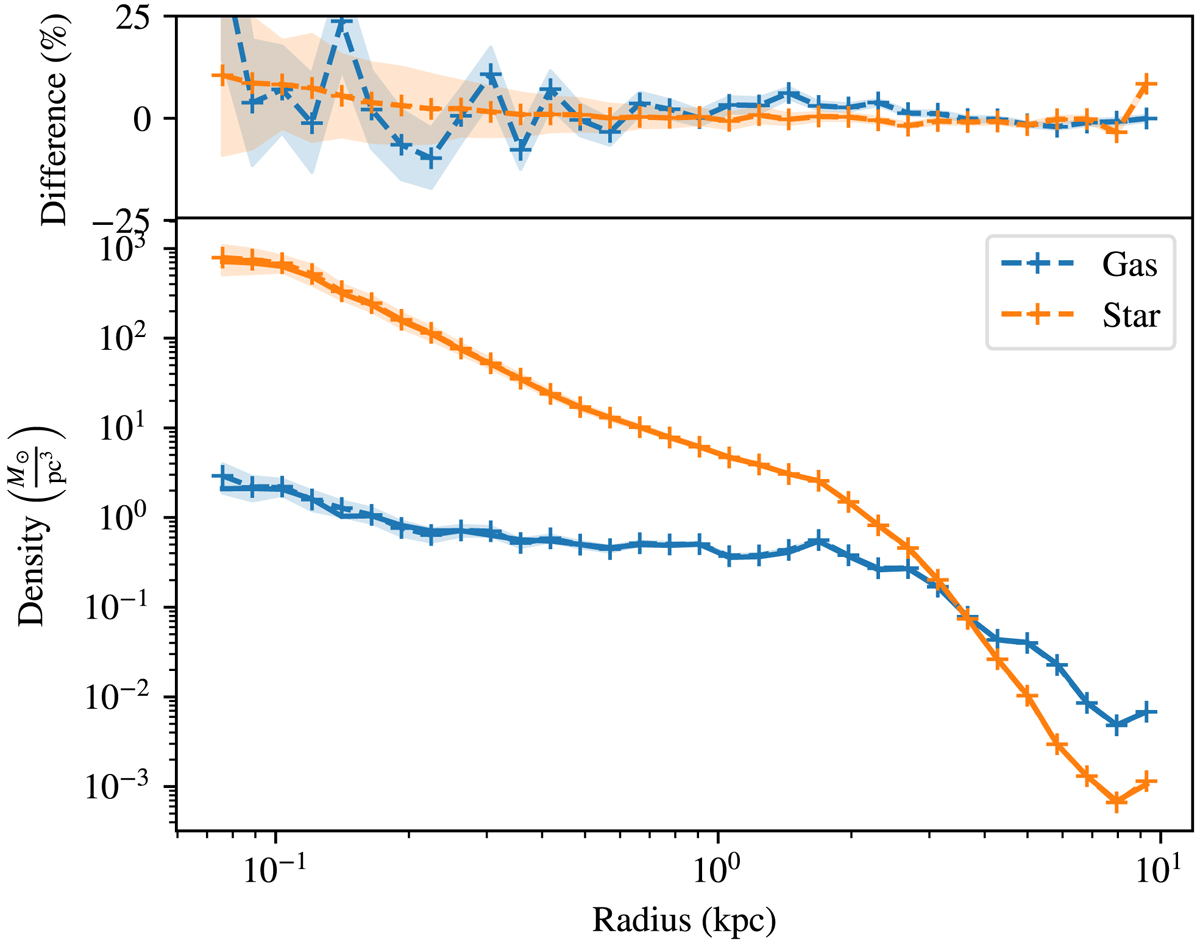
Bottom panel: radial profile of the gas density (solid blue) and star density (solid orange) vs. the gas tracer density (blue cross) and the star-tracer density (orange cross). The error bars are given by a Poisson sampling noise. Top panel: relative difference between the baryon and the tracer profiles. The tracers match their baryon counterpart at a few percent level.
Current usage metrics show cumulative count of Article Views (full-text article views including HTML views, PDF and ePub downloads, according to the available data) and Abstracts Views on Vision4Press platform.
Data correspond to usage on the plateform after 2015. The current usage metrics is available 48-96 hours after online publication and is updated daily on week days.
Initial download of the metrics may take a while.