Fig. 13.
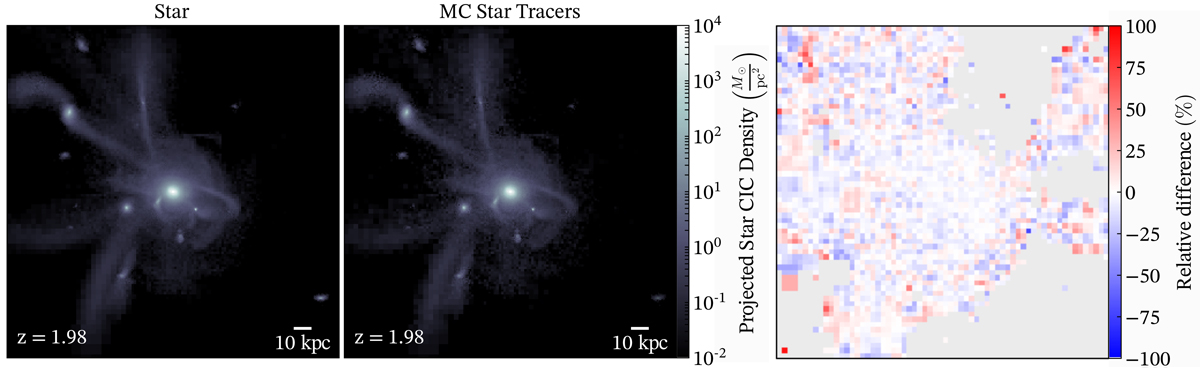
Stellar surface density (left panel), star-tracer surface density (centre panel), and relative difference (right panel). The data are the same as in Fig. 10. In the difference map, regions where no stars are found are indicated in grey. The star and star-tracer distributions are in very good agreement; their difference shows no spatial dependence. The noise level is higher than in Fig. 10 at large radii where the star surface density is smaller than the gas surface density, hence the star mass distribution is less resolved than the gas.
Current usage metrics show cumulative count of Article Views (full-text article views including HTML views, PDF and ePub downloads, according to the available data) and Abstracts Views on Vision4Press platform.
Data correspond to usage on the plateform after 2015. The current usage metrics is available 48-96 hours after online publication and is updated daily on week days.
Initial download of the metrics may take a while.