Fig. 12.
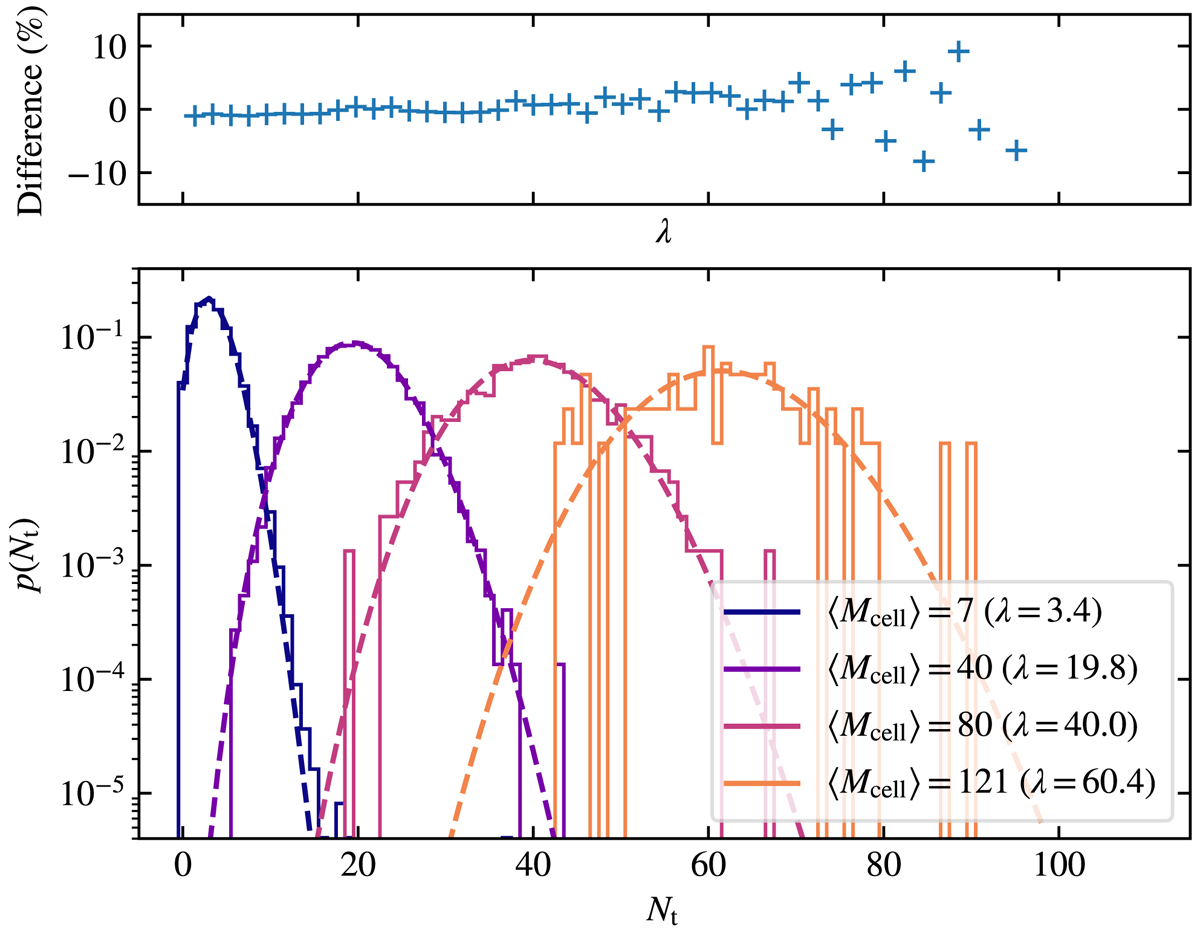
Bottom panel: distribution of the number of gas tracers for different cell-mass bins as observed in the simulation (solid lines) vs. a Poisson distribution with parameter λ = ⟨Mcell⟩/mt (dashed lines, reported in the legend). Top panel: relative difference between the observed mean number of tracer particles and the expected one, λ, as a function of λ. For all cells, the distribution of the number of gas tracers per cell is given by a Poisson distribution with parameter λ.
Current usage metrics show cumulative count of Article Views (full-text article views including HTML views, PDF and ePub downloads, according to the available data) and Abstracts Views on Vision4Press platform.
Data correspond to usage on the plateform after 2015. The current usage metrics is available 48-96 hours after online publication and is updated daily on week days.
Initial download of the metrics may take a while.