Fig. 10.
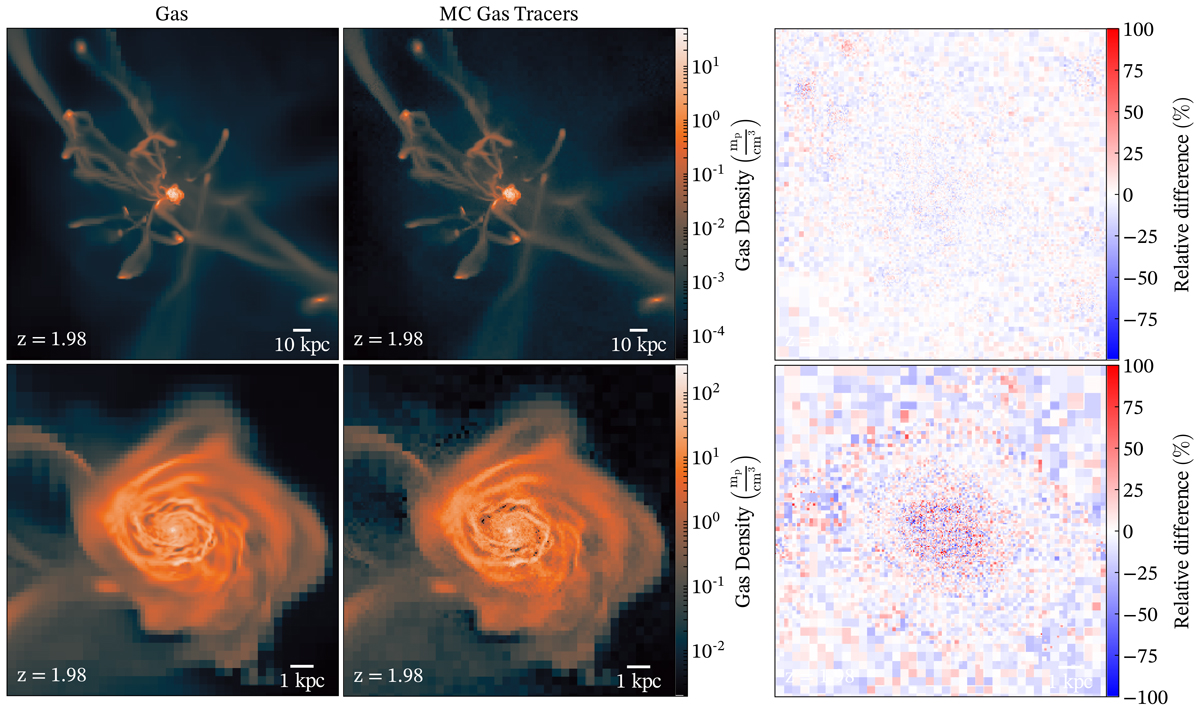
Density-weighted projection of the gas density (left panels), of the gas tracer density (centre panels), and of their relative difference (right panels) along the x axis around the most massive galaxy of the cosmological simulation at z = 2. Top panels: large-scale structure of the gas; data have been selected within 200 kpc of the centre. Bottom panels: zoom on the central galaxy; data have been selected within 10 kpc of the centre of the galaxy. The MC tracer density is similar to that of the gas. The radial modulations are due to differences in cell mass at fixed cell resolution: massive cells (closer to the centre at fixed resolution) are best sampled by the MC tracers.
Current usage metrics show cumulative count of Article Views (full-text article views including HTML views, PDF and ePub downloads, according to the available data) and Abstracts Views on Vision4Press platform.
Data correspond to usage on the plateform after 2015. The current usage metrics is available 48-96 hours after online publication and is updated daily on week days.
Initial download of the metrics may take a while.