Fig. 3.
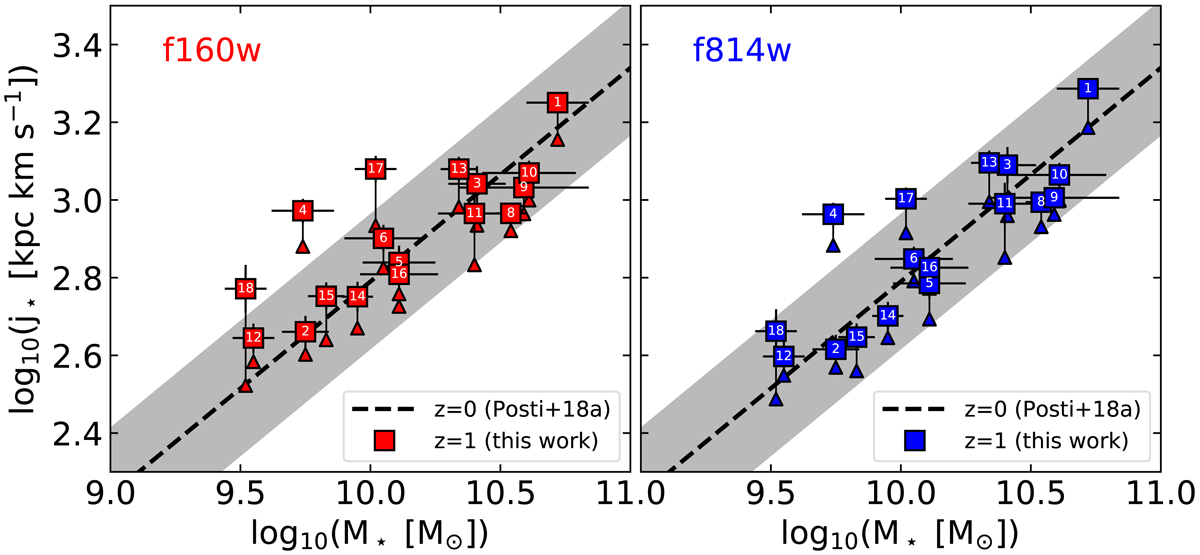
Fall relation for our sample of disc galaxies at z ∼ 1. Left (right) panel: results derived using the f160w (f814w) HST band. The squared symbols show the j⋆ determined for a flat rotation curve extrapolation, while the upwards triangles represent lower limits derived from the assumption of a Keplerian fall-off. Numbers correspond to galaxy IDs from Table A.1. The black-dashed line and the grey-shaded region show the Fall relation and its intrinsic scatter, respectively, as determined by Posti et al. (2018b) for disc galaxies in the local universe from the SPARC data of Lelli et al. (2016).
Current usage metrics show cumulative count of Article Views (full-text article views including HTML views, PDF and ePub downloads, according to the available data) and Abstracts Views on Vision4Press platform.
Data correspond to usage on the plateform after 2015. The current usage metrics is available 48-96 hours after online publication and is updated daily on week days.
Initial download of the metrics may take a while.