Fig. 2.
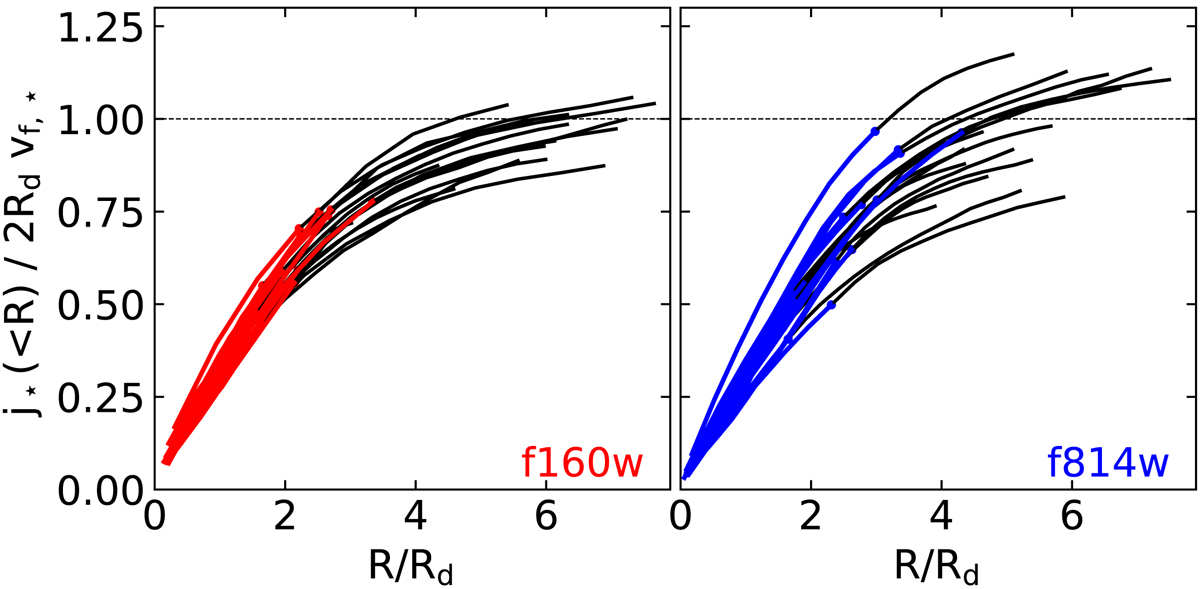
Cumulative j⋆ profiles for our 17 galaxies in the f160w (left panel) and f814w (right panel) bands. Coloured solid lines show the innermost regions where rotation velocities from Hα data are available, while solid black lines show the extrapolation for a flat rotation curve. All profiles are either converging or have fully converged.
Current usage metrics show cumulative count of Article Views (full-text article views including HTML views, PDF and ePub downloads, according to the available data) and Abstracts Views on Vision4Press platform.
Data correspond to usage on the plateform after 2015. The current usage metrics is available 48-96 hours after online publication and is updated daily on week days.
Initial download of the metrics may take a while.