Fig. 1.
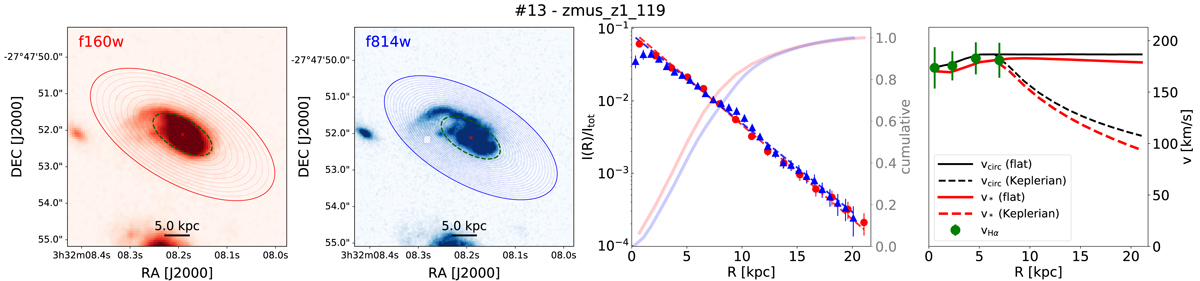
Photometry and kinematics of galaxy zmus_z1_119. First panel: HST image in f160w band (rest-frame I band). The concentric ellipses show the annuli where the surface brightness is computed. The green dashed ellipse shows the radius of the outermost Hα rotation velocity point. The blank region in the f814w image has been masked by our sigma-rejection algorithm (see text). Second panel: as in the first panel, but for the f814w band (rest-frame B band). Third panel: surface-brightness profiles in bands f160w (red circles) and f814w (blue triangles), normalised to the total light within the outermost ring. The thin dashed lines show exponential fits for R > 3.5 kpc, the solid thick lines show the cumulative light profile. Fourth panel: rotation curves. Points with error bars show υHα as determined by TFM16. The black and the red solid (dashed) lines show our fiducial profiles for υcirc and υ⋆ respectively, assuming a flat (Keplerian) extrapolation for the circular velocity.
Current usage metrics show cumulative count of Article Views (full-text article views including HTML views, PDF and ePub downloads, according to the available data) and Abstracts Views on Vision4Press platform.
Data correspond to usage on the plateform after 2015. The current usage metrics is available 48-96 hours after online publication and is updated daily on week days.
Initial download of the metrics may take a while.