Fig. 9.
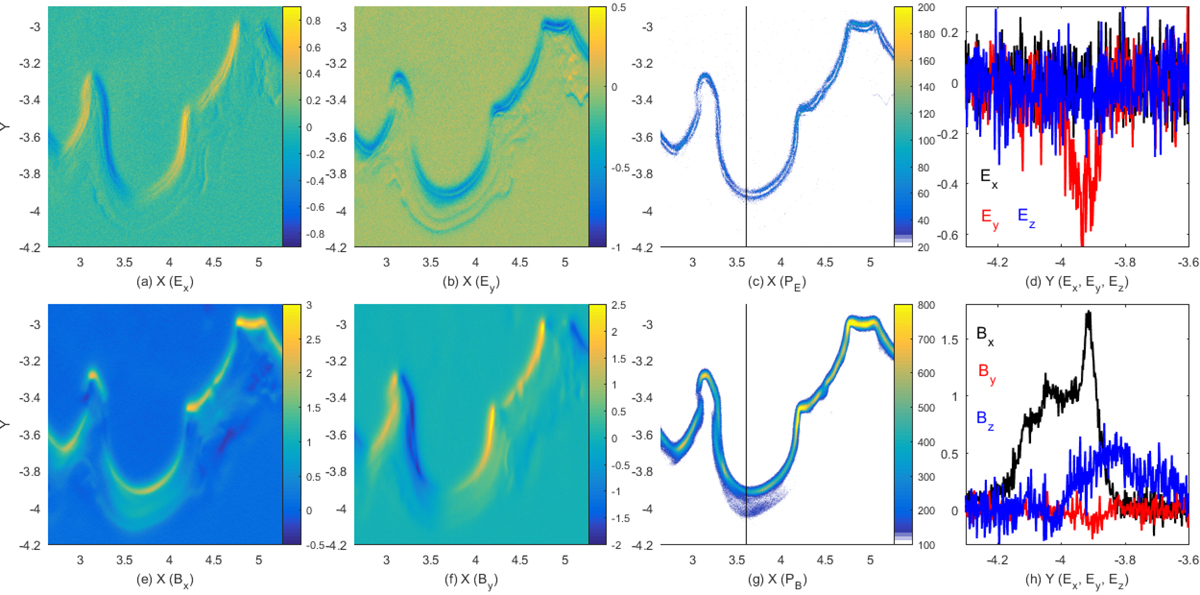
Electromagnetic fields at the time t = tsim in full spatial resolution. Panels a and b: electric Ex and Ey components. The pressure ![]() is shown in panel c. Panel d: electric field components along the vertical line in panel c. Panels e and f: magnetic Bx and By components. Panel g: magnetic pressure
is shown in panel c. Panel d: electric field components along the vertical line in panel c. Panels e and f: magnetic Bx and By components. Panel g: magnetic pressure ![]() (color scale clamped to 800). Panel h: magnetic field components along the vertical line in panel g. The vertical lines in (c, g) mark x = 3.6.
(color scale clamped to 800). Panel h: magnetic field components along the vertical line in panel g. The vertical lines in (c, g) mark x = 3.6.
Current usage metrics show cumulative count of Article Views (full-text article views including HTML views, PDF and ePub downloads, according to the available data) and Abstracts Views on Vision4Press platform.
Data correspond to usage on the plateform after 2015. The current usage metrics is available 48-96 hours after online publication and is updated daily on week days.
Initial download of the metrics may take a while.