Fig. 6.
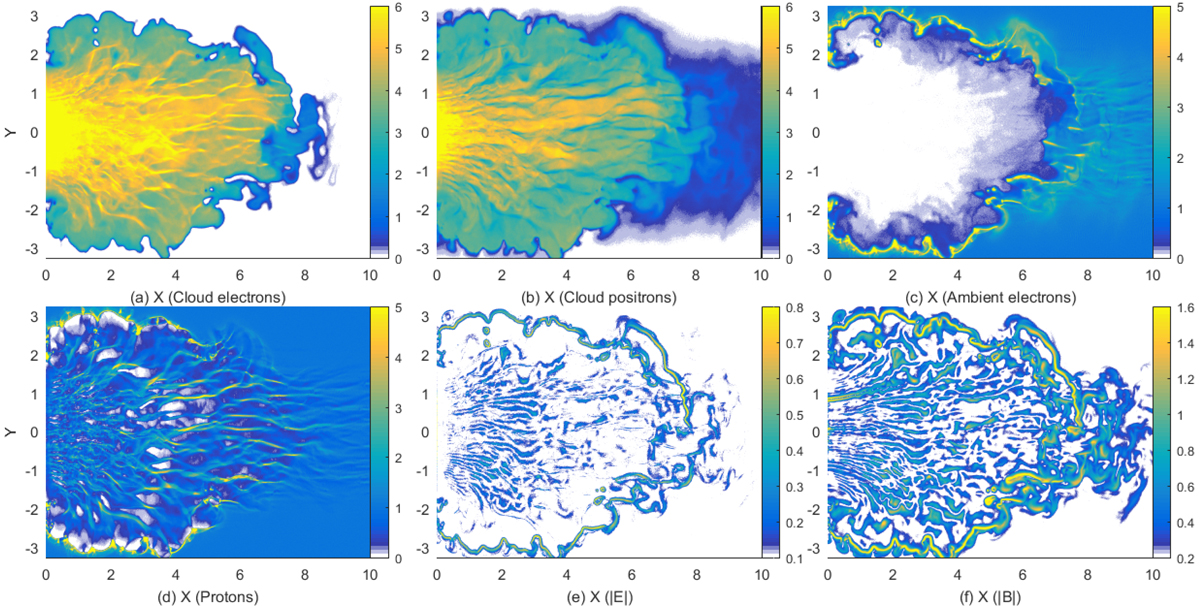
Plasma and field distributions at t3 = 20. Panels a and b: distributions of the cloud electrons and positrons. The electrons and protons of the ambient plasma are shown in panels c and d, respectively. Panel e: electric field modulus |E|, and |B| is shown in panel f. The electric and magnetic amplitudes are clamped to values 0.1 and 0.2 to remove noise.
Current usage metrics show cumulative count of Article Views (full-text article views including HTML views, PDF and ePub downloads, according to the available data) and Abstracts Views on Vision4Press platform.
Data correspond to usage on the plateform after 2015. The current usage metrics is available 48-96 hours after online publication and is updated daily on week days.
Initial download of the metrics may take a while.