Fig. 5.
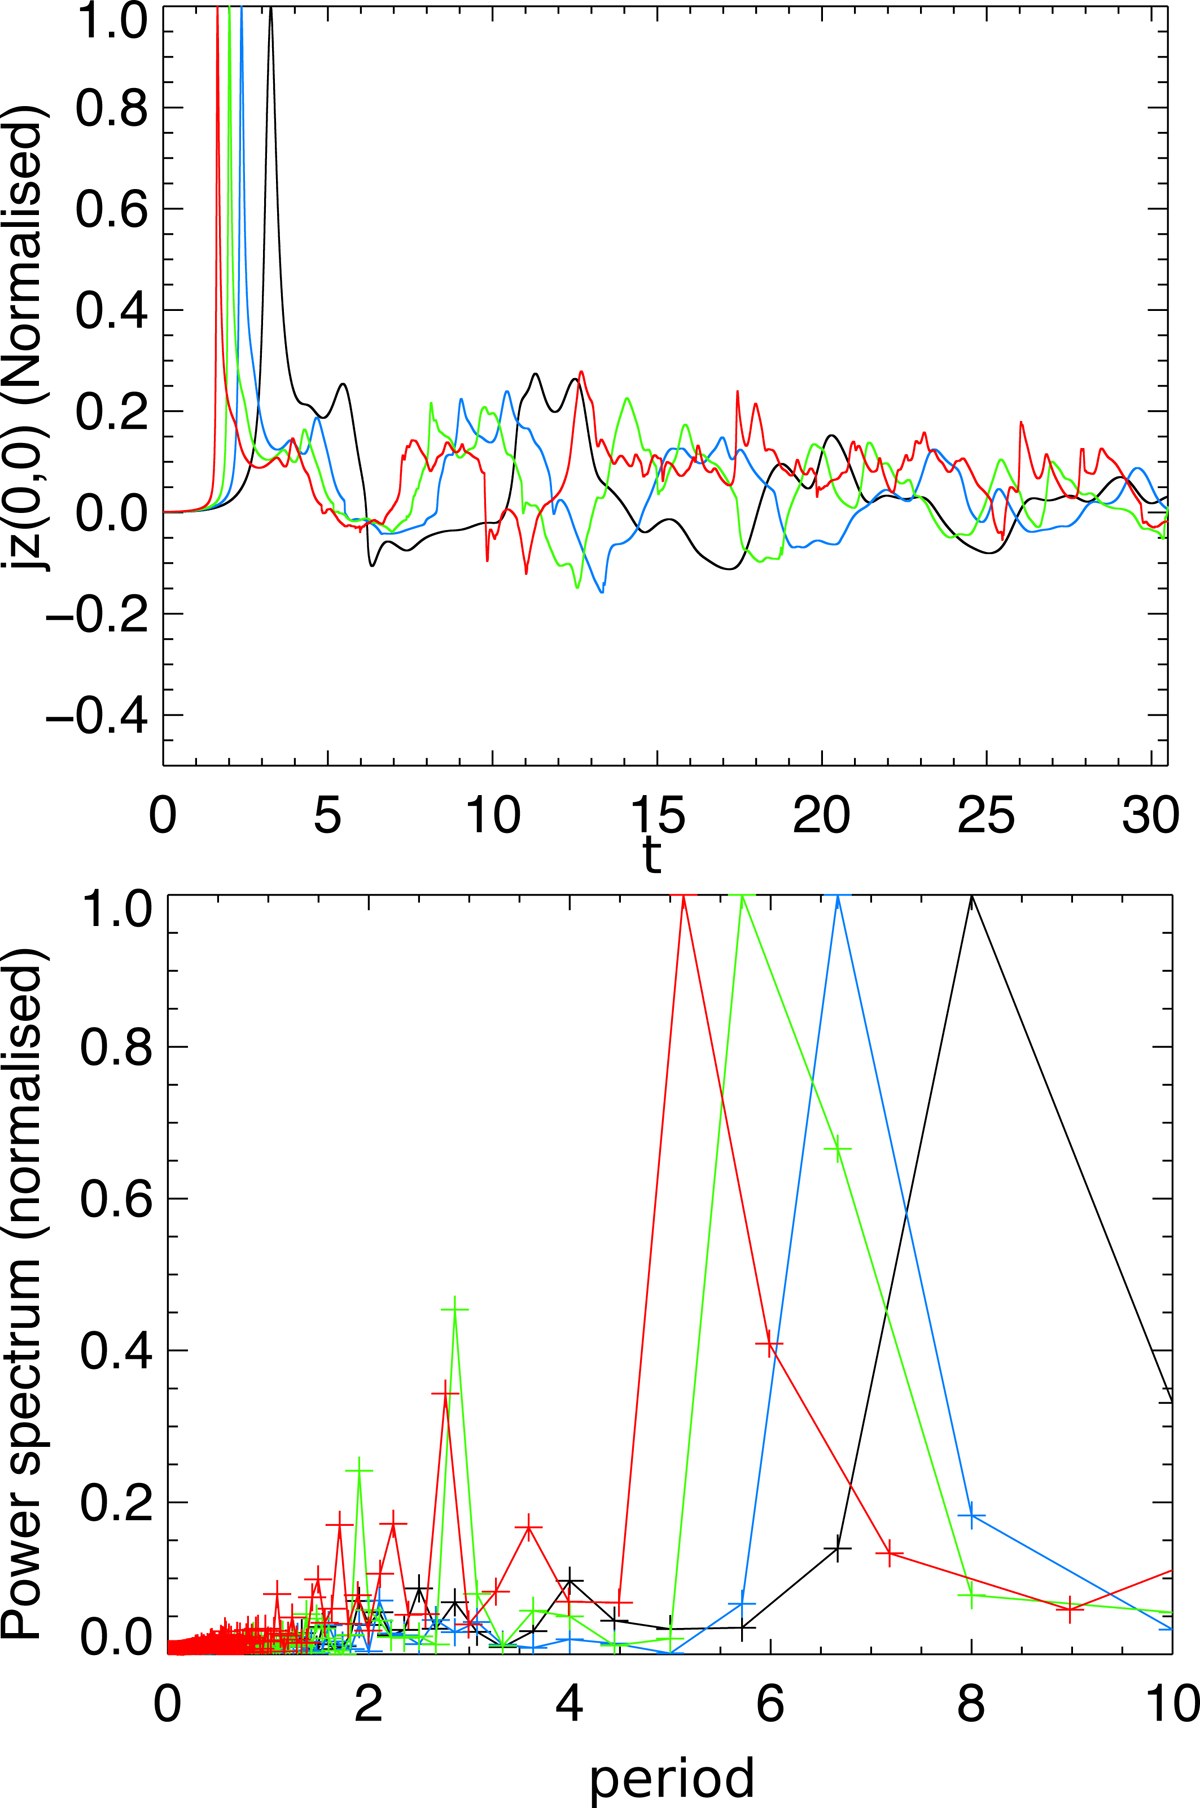
Top panel: curves of normalised jz recorded at the null for fixed resistivity η = 10−4 and perturbation amplitudes j0 = 0.01 (black), 0.05 (blue), 0.1 (green), 0.2 (red). It is visually clear that the larger amplitude perturbations form the initial current sheet more rapidly (tc occurs earlier, the initial maxima) and subsequently associated with higher frequency oscillations, both in terms of the reversal periods and the frequency of the secondary (same signed) peaks. Bottom panel: normalised Fourier power spectra distribution indicating the dominant period. There is a clear decrease in the dominant period (associated with the main reversal cycle) as perturbation energy increases. Additionally, we note that as the amplitude is increased, spectral power in the lower-period (higher frequency) oscillations is also increased.
Current usage metrics show cumulative count of Article Views (full-text article views including HTML views, PDF and ePub downloads, according to the available data) and Abstracts Views on Vision4Press platform.
Data correspond to usage on the plateform after 2015. The current usage metrics is available 48-96 hours after online publication and is updated daily on week days.
Initial download of the metrics may take a while.