Fig. 4.
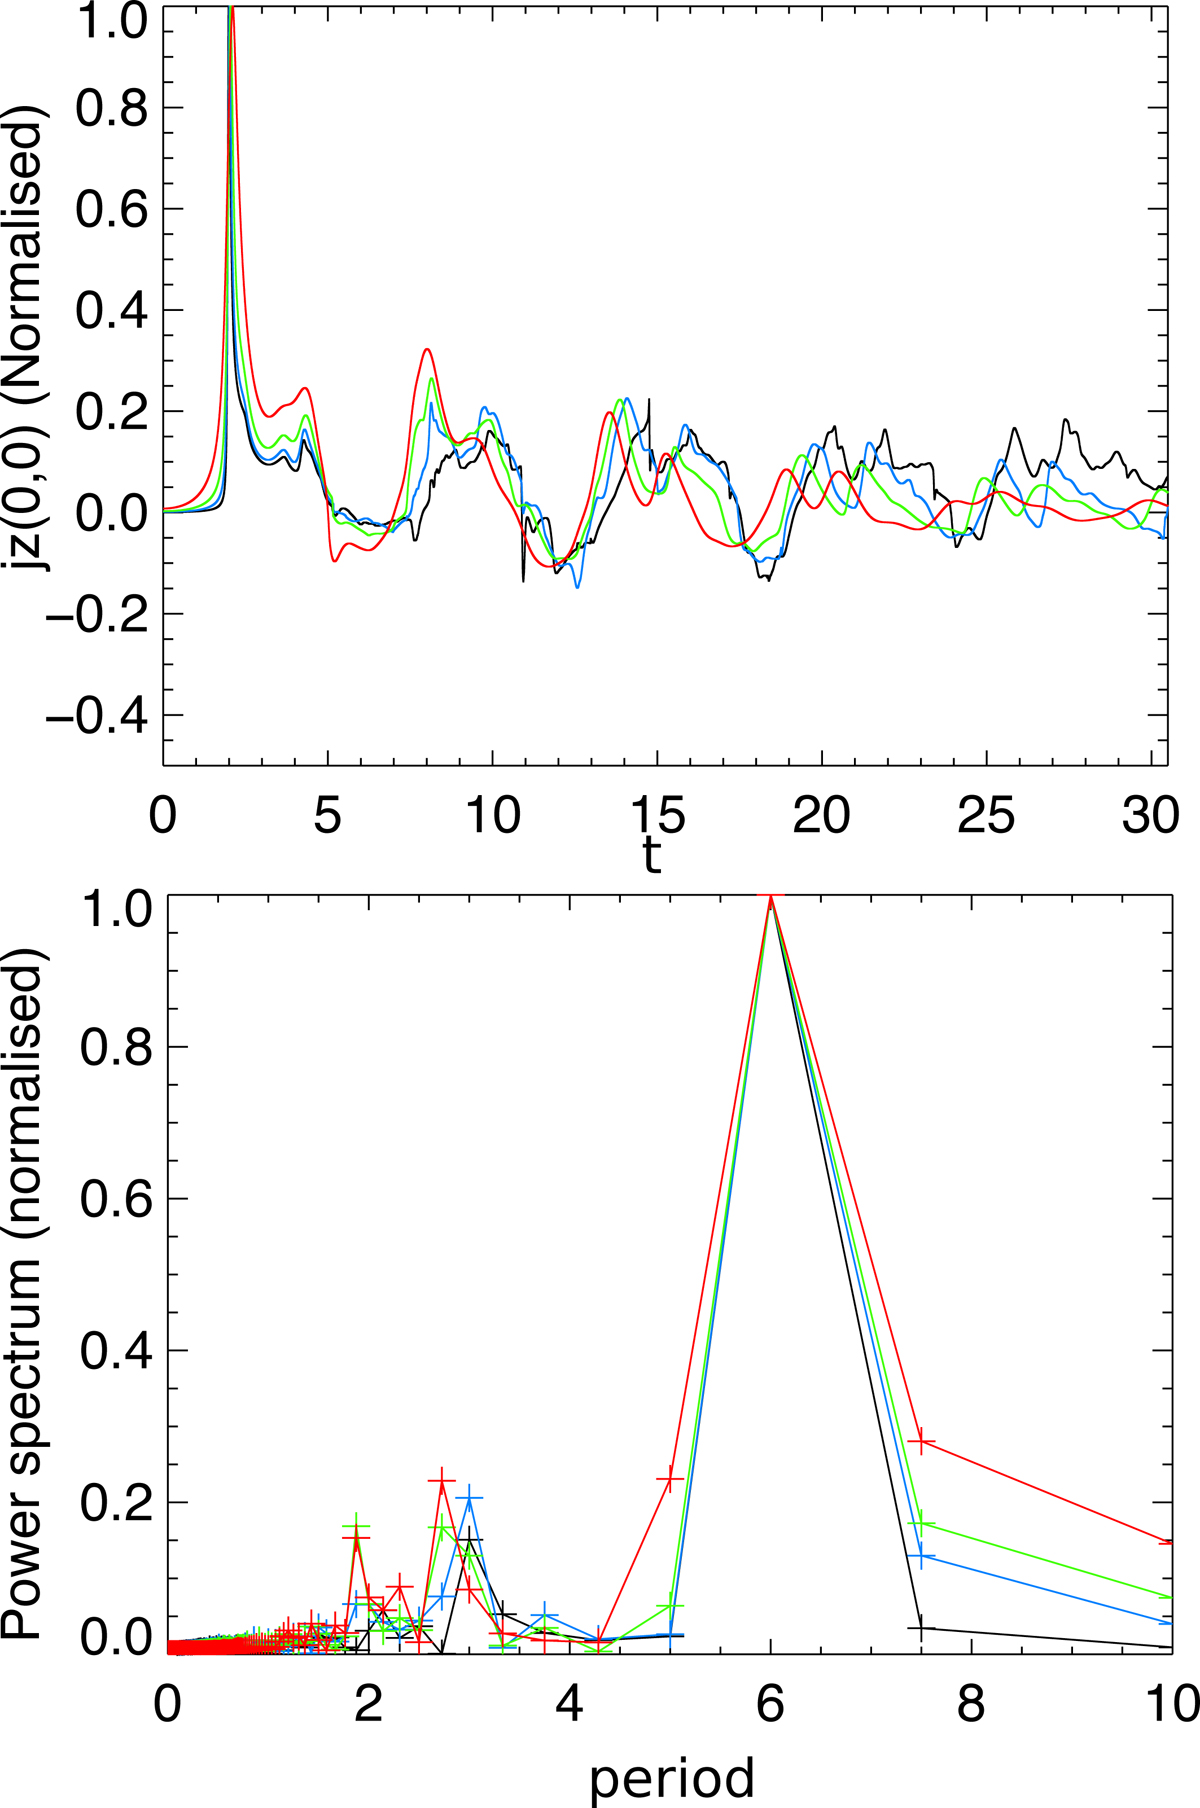
Top panel: curves of normalised jz recorded at the null for a range of resistivities with fixed perturbation amplitude j0 = 0.1 (sufficient for the initial collapse to enter nonlinear evolution in all cases shown). Whilst it is clear that the signals are not identical and that additional dissipation affects the curve (in particular, its smoothness), it is clear visually that the effect of resistivity upon the period(s) is much weaker than in the linear case. Bottom panel: normalised Fourier power spectra distribution. The dominant spectral bin, is unchanged with η, indicating that any change in the main reversal period (change in current sheet sign and orientation) is only weakly dependent on resistivity, such that we cannot detect it with this sample. In both panels, red corresponds to the lowest resistivity (η = 3 × 10⁻⁵) and black to the highest (η = 1 × 10⁻³).
Current usage metrics show cumulative count of Article Views (full-text article views including HTML views, PDF and ePub downloads, according to the available data) and Abstracts Views on Vision4Press platform.
Data correspond to usage on the plateform after 2015. The current usage metrics is available 48-96 hours after online publication and is updated daily on week days.
Initial download of the metrics may take a while.