Fig. 2.
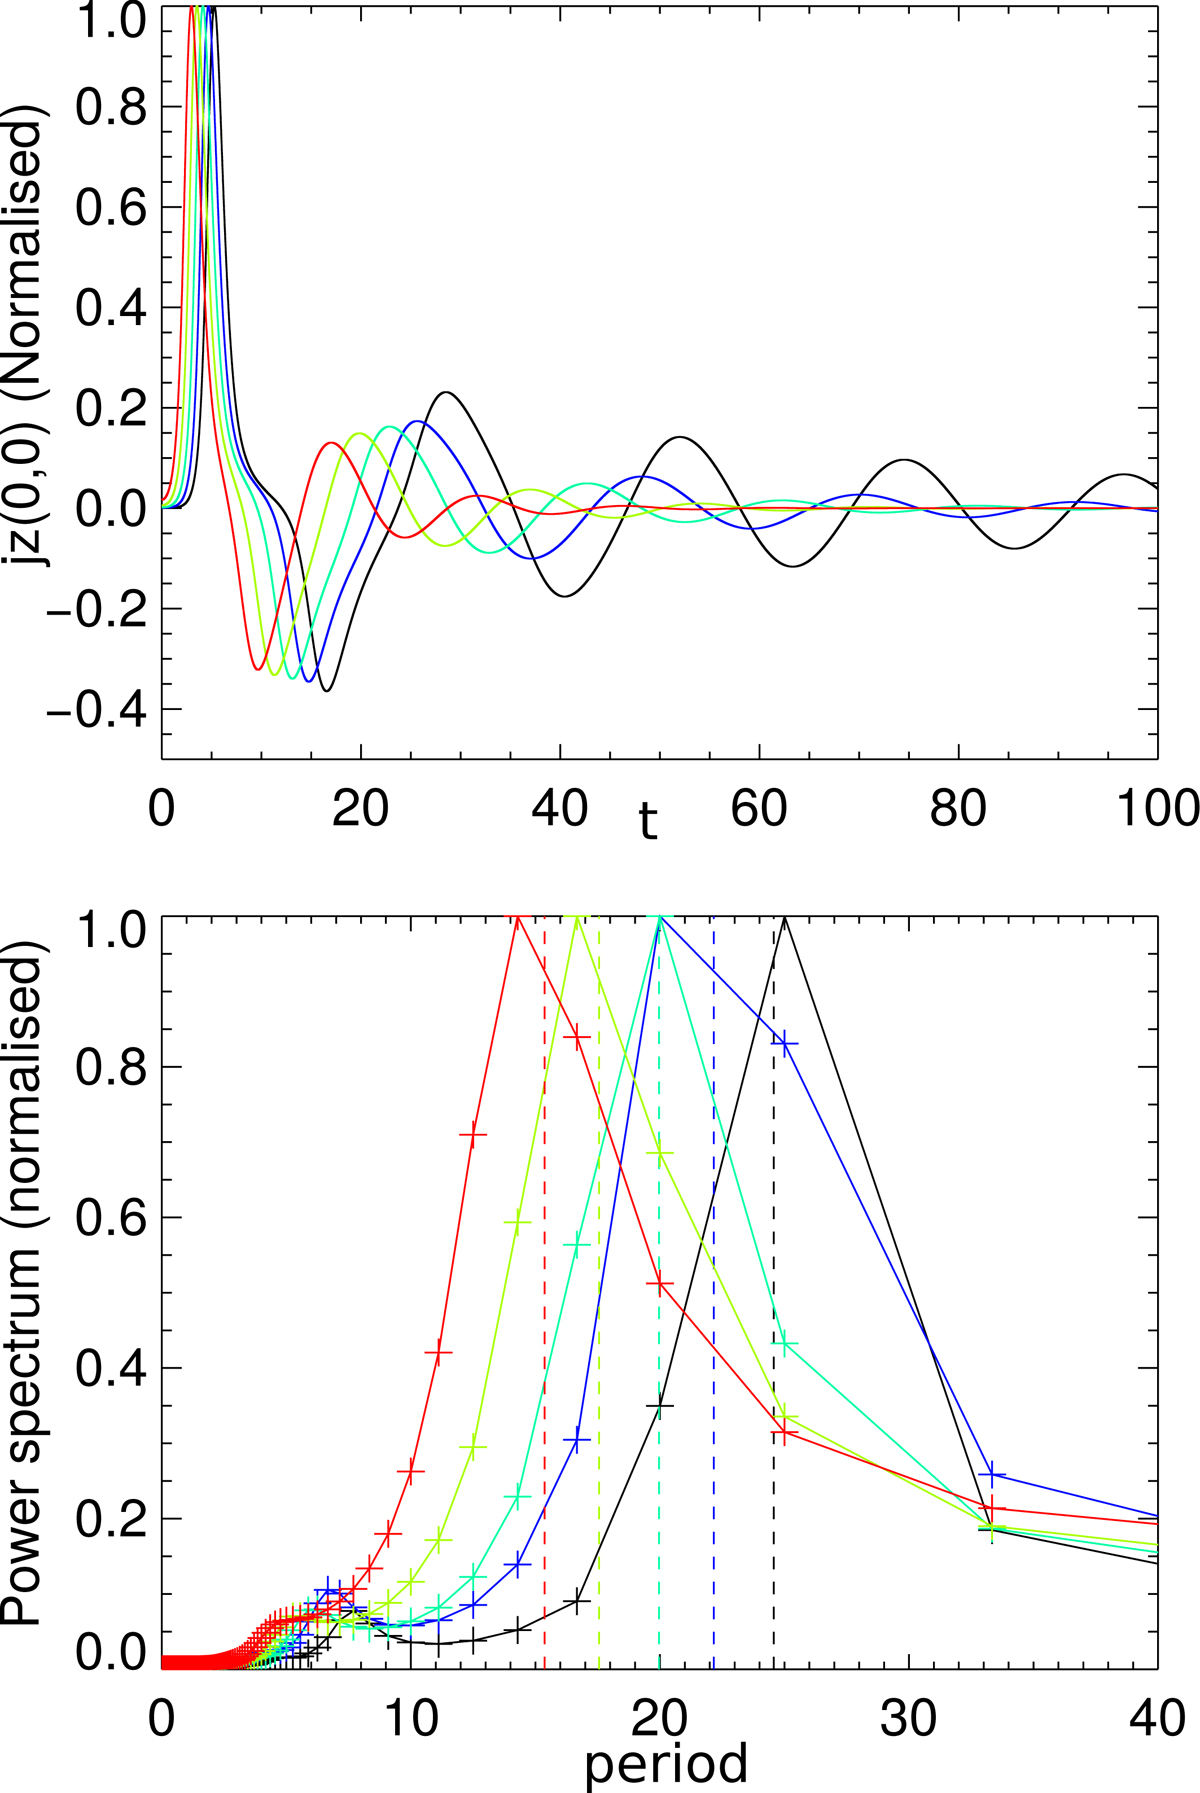
Top panel: curves of normalised jz recorded at the null during linear oscillatory reconnection (j0 = 10−5 < η) for a range of resistivity from η = 3 × 10⁻⁵ (black) through η = 1 × 10⁻³ (red) as per Table 1 (following maxima left to right, the curves go from higher to lower resistivity). Bottom panel: normalised Fourier power spectrum indicating the dominant period measured in the jz(0, 0)-signals above. The vertical dashed lines indicate the expected period according to Eq. (7), which is consistent with the dominant periodicity bin in all cases.
Current usage metrics show cumulative count of Article Views (full-text article views including HTML views, PDF and ePub downloads, according to the available data) and Abstracts Views on Vision4Press platform.
Data correspond to usage on the plateform after 2015. The current usage metrics is available 48-96 hours after online publication and is updated daily on week days.
Initial download of the metrics may take a while.