Fig. 2.
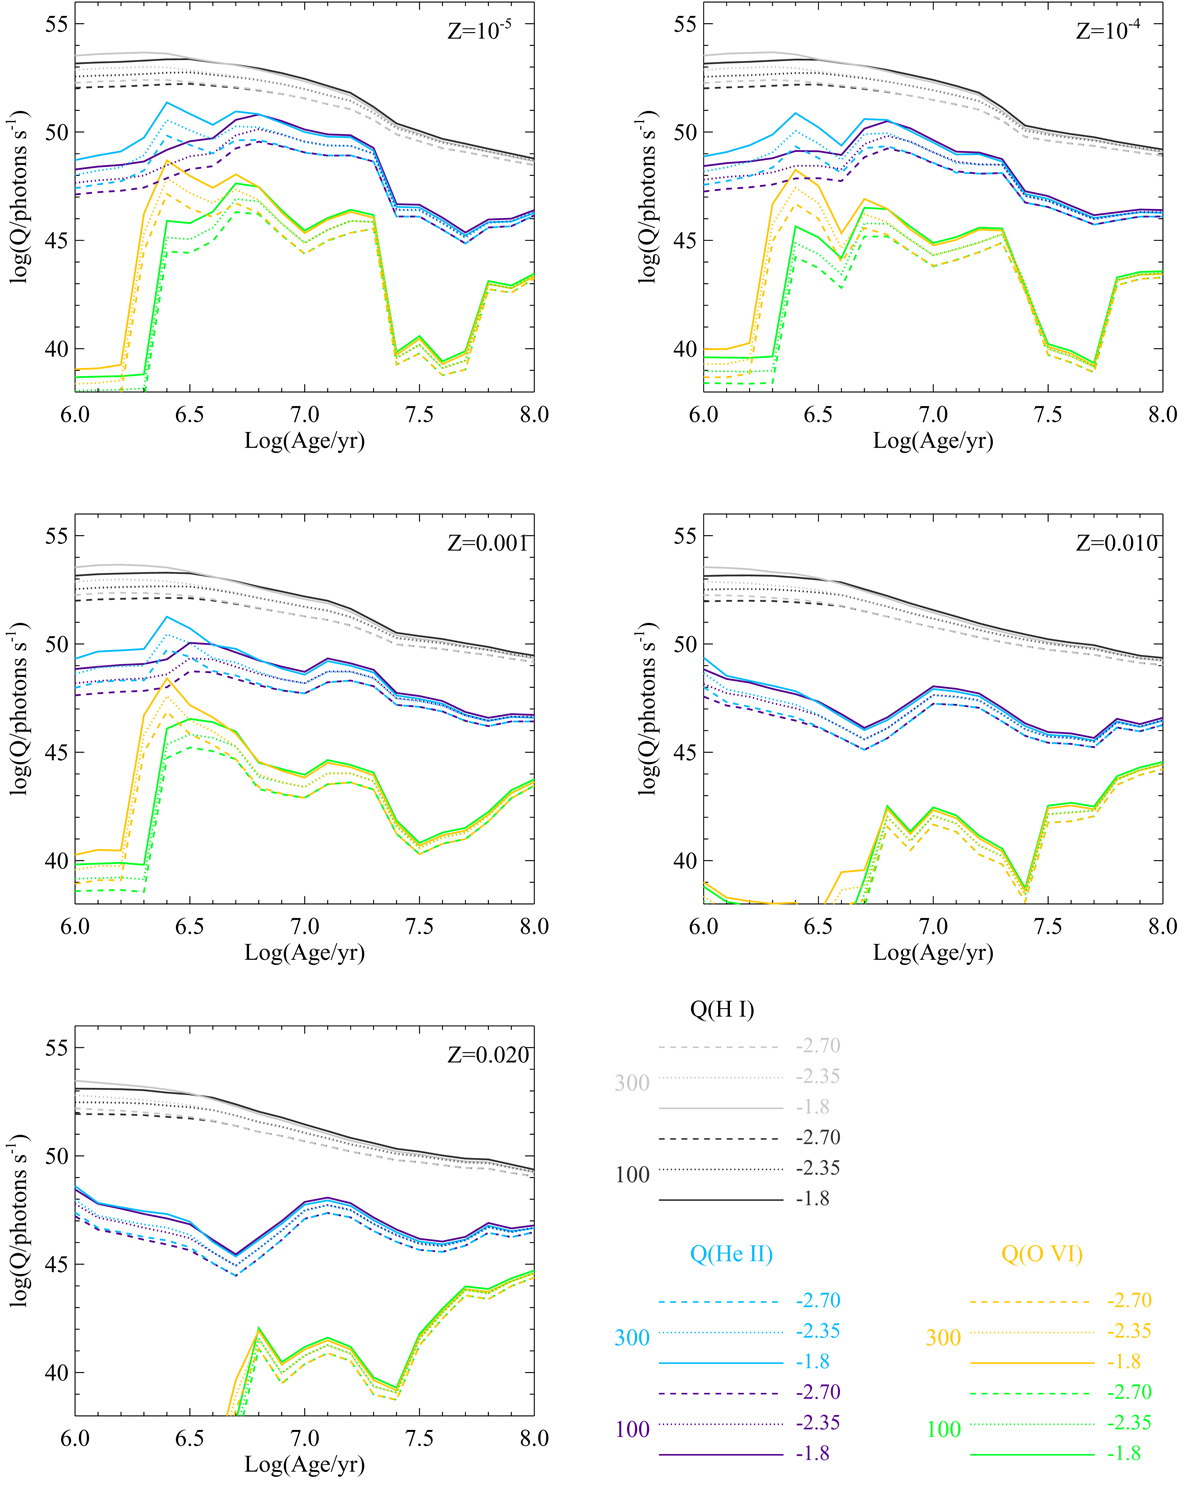
Time evolution of photon production rates in H I (black), He II (blue) and O VI (yellow-green) at five metallicities, from an instantaneous burst of total mass 106 M⊙ occurring at an age of zero. At each metallicity three single-break power law (αu = αm = −1.8, −2.35, −2.70) IMF models are shown at two upper mass limits (Mu = 100, 300 M⊙), with line style indicating different slopes and line colour different upper mass cut-offs as indicated in the key. The rest of the models lie within the bounds of those shown at fixed age.
Current usage metrics show cumulative count of Article Views (full-text article views including HTML views, PDF and ePub downloads, according to the available data) and Abstracts Views on Vision4Press platform.
Data correspond to usage on the plateform after 2015. The current usage metrics is available 48-96 hours after online publication and is updated daily on week days.
Initial download of the metrics may take a while.