Fig. 12.
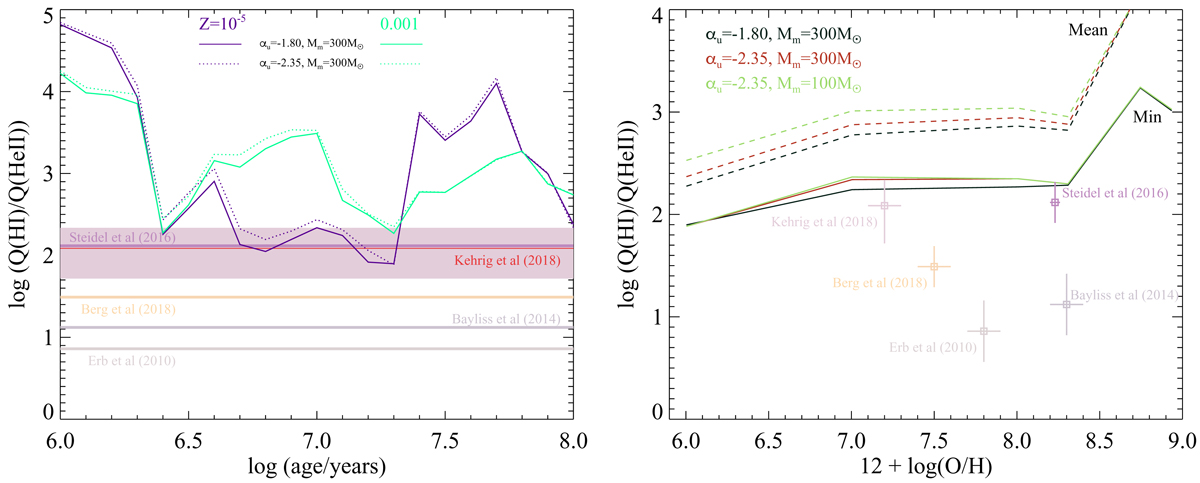
Q(H I)/Q(He II) ratios attained by our most extreme models (typically those with αm = αu = −1.8 and Mu = 300 M⊙) compared to those of the BPASS default model ( αm = αu = −2.35 and Mu = 300 M⊙) and observational constraints from the literature. Left-hand panel: time evolution of the photon flux ratio at two metallicities, illustrating the brief lifetime of the hardest ratios. Right hand panel: both the hardest ratios attained at a given metallicity and the mean ratio over the first 20 Myr of stellar evolution are shown. In both panels, we compare to observational data as indicated in the labels and in Sect. 6. The filled region in the left hand panel (and error bars on the relevant point in the right hand panel) indicates the range of values measured for different regions in the resolved galaxy SBS 0335-052E (D = 54 Mpc, Kehrig et al. 2018).
Current usage metrics show cumulative count of Article Views (full-text article views including HTML views, PDF and ePub downloads, according to the available data) and Abstracts Views on Vision4Press platform.
Data correspond to usage on the plateform after 2015. The current usage metrics is available 48-96 hours after online publication and is updated daily on week days.
Initial download of the metrics may take a while.