Fig. 3
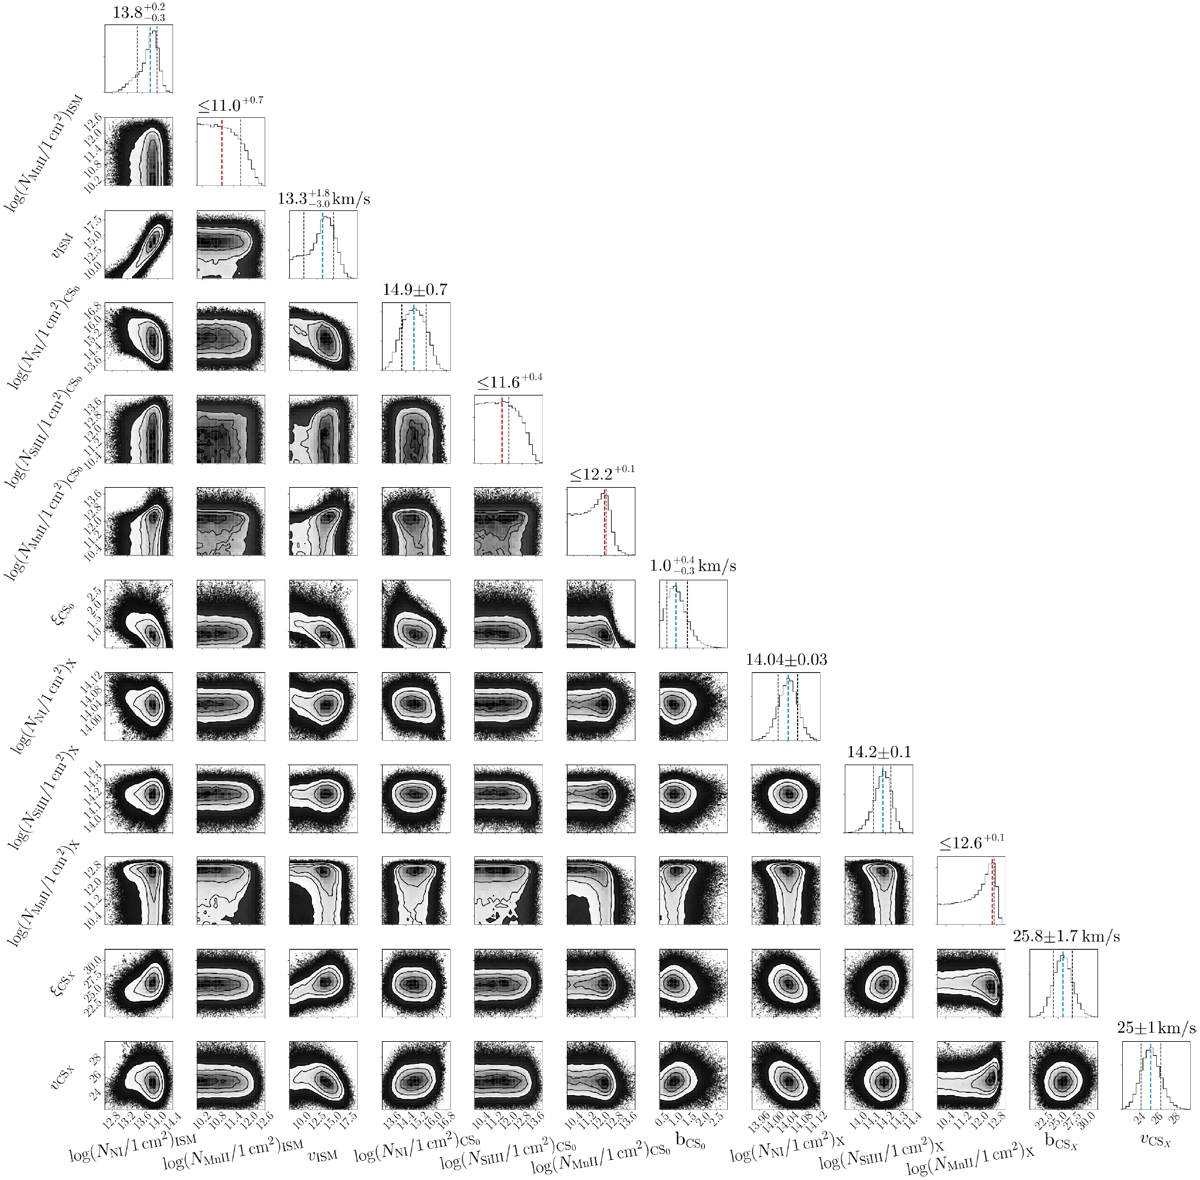
Corner plot showing the 1D and 2D projections of the posterior probability distributions for the free parameters. The blue dashed lines indicate the mean of the distribution. The black dashed lines in each of the 1D histograms represent the 1 σ deviations (68% of the mass). The central dashed line indicates the median value. The solid black lines in each of the 2D histograms represent the 1, 2, and 3 σ levels, respectively (with 1 σ = 39.3% of the volume). The red dashed lines indicate the mode of the distribution. The uncertainty for the parameters that only have an upper uncertainty was calculated assuming a truncated Gaussian distribution.
Current usage metrics show cumulative count of Article Views (full-text article views including HTML views, PDF and ePub downloads, according to the available data) and Abstracts Views on Vision4Press platform.
Data correspond to usage on the plateform after 2015. The current usage metrics is available 48-96 hours after online publication and is updated daily on week days.
Initial download of the metrics may take a while.