Fig. 8.
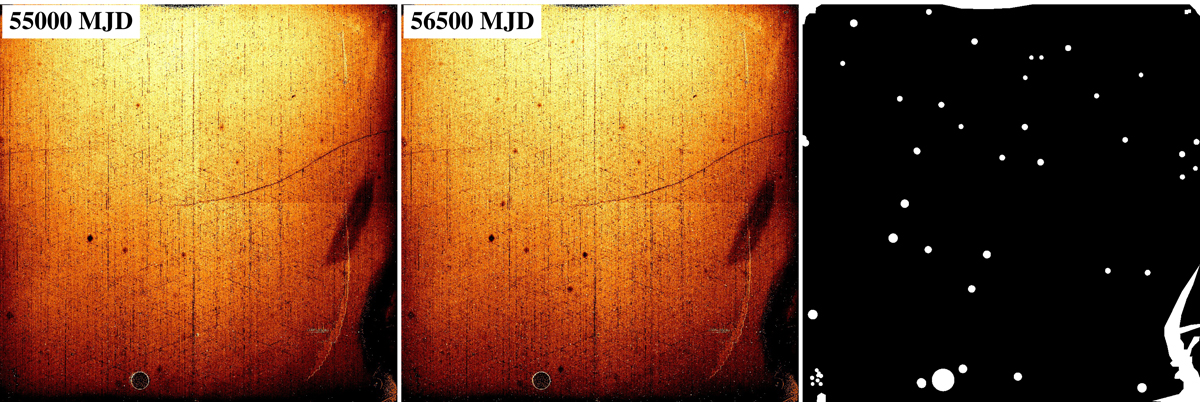
Example of identification using two extreme flat fields, calculated for June 2009 (55000 MJD, left panel) and July 2013 (56500 MJD, central panel). Right panel: final data quality array. We represent in white those regions of the detector labelled as bad pixels. We note that this data quality array has to be combined with the individual data quality arrays from each individual exposure, containing the cosmic rays masks, the pixels affected by persistence, and the default time-dependent WFC3 IR blobs.
Current usage metrics show cumulative count of Article Views (full-text article views including HTML views, PDF and ePub downloads, according to the available data) and Abstracts Views on Vision4Press platform.
Data correspond to usage on the plateform after 2015. The current usage metrics is available 48-96 hours after online publication and is updated daily on week days.
Initial download of the metrics may take a while.