Fig. 4.
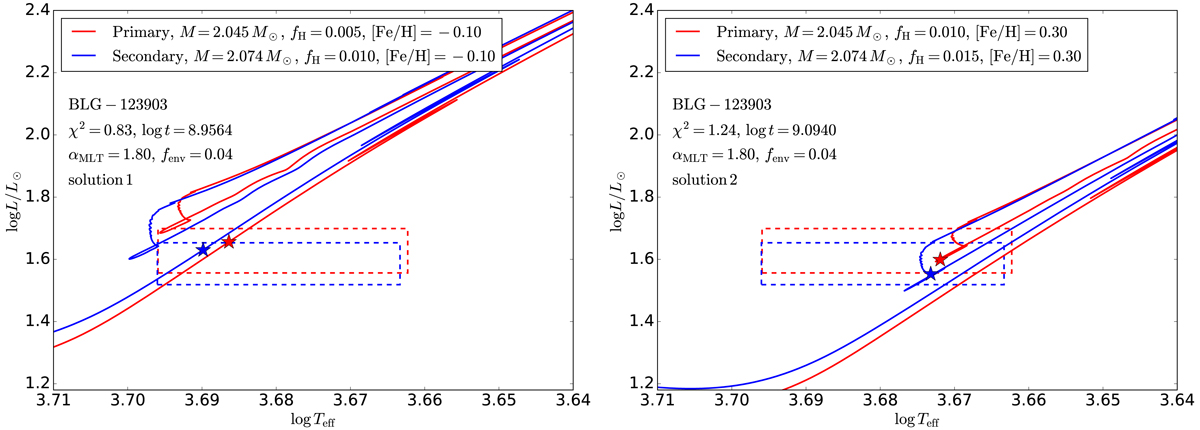
HR diagrams with sections of MESA evolutionary tracks around two solutions for the system BLG-123903. Red lines are used for the primary component and blue lines for the secondary component. Red and blue dashed rectangles show the 1σ error boxes for primary and secondary component, respectively, and red and blue asterisks mark the locations of the models fitted for the primary and the secondary, respectively.
Current usage metrics show cumulative count of Article Views (full-text article views including HTML views, PDF and ePub downloads, according to the available data) and Abstracts Views on Vision4Press platform.
Data correspond to usage on the plateform after 2015. The current usage metrics is available 48-96 hours after online publication and is updated daily on week days.
Initial download of the metrics may take a while.