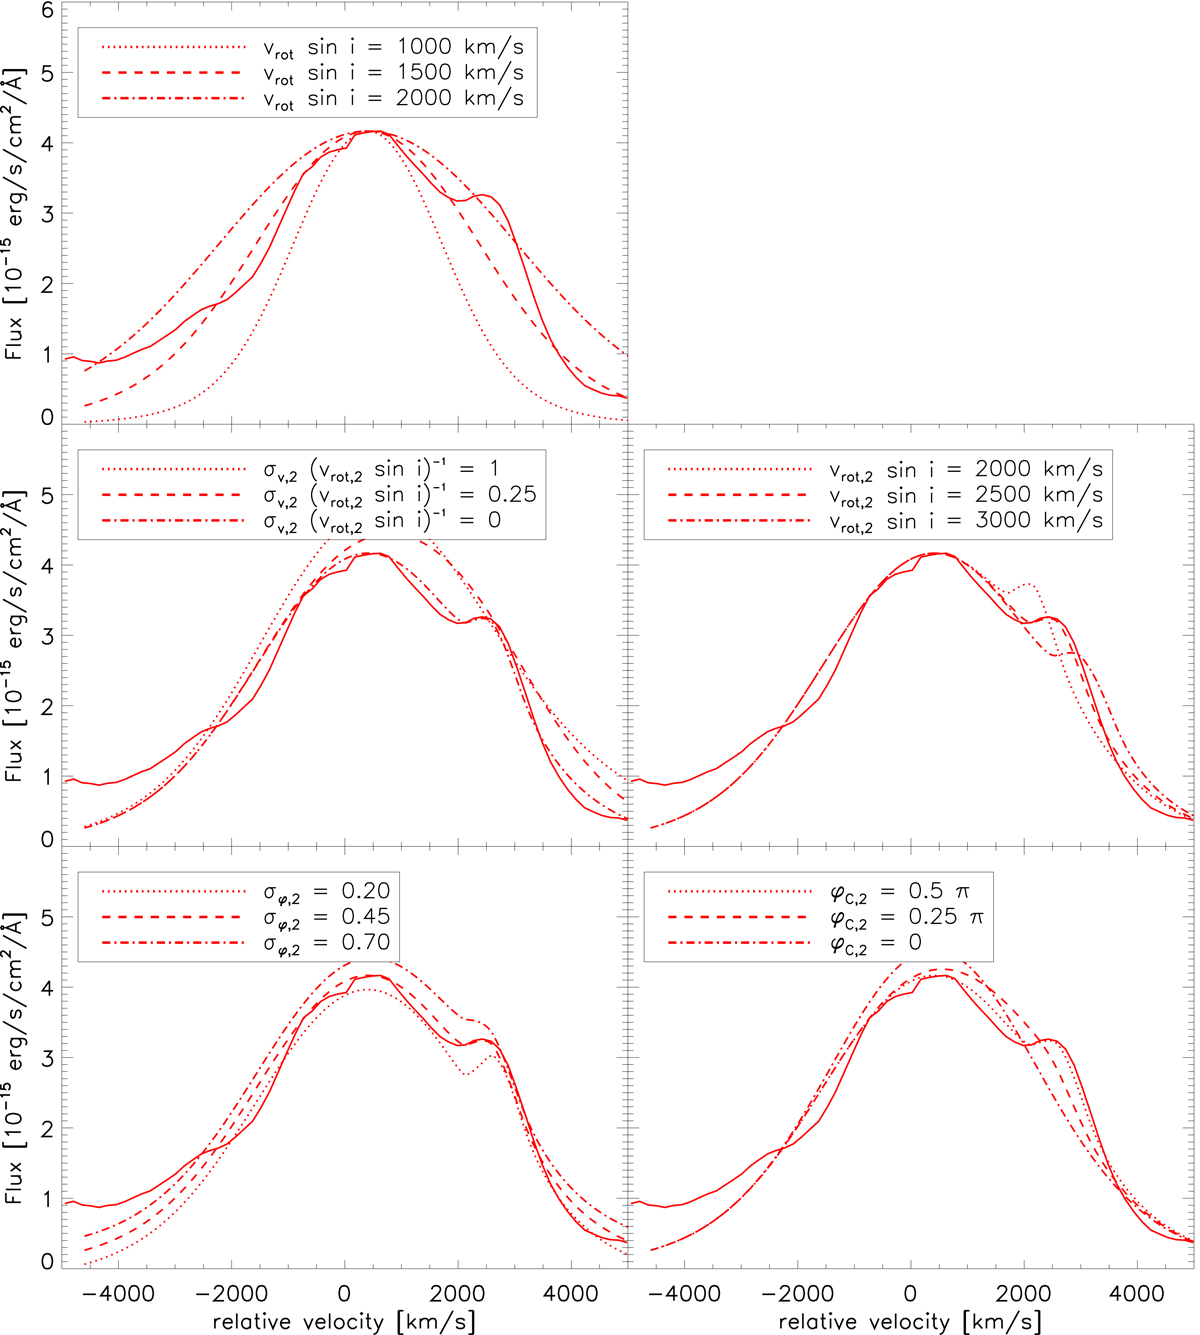
Fig. 9.

Influence of some of the parameter space of Eq. (6) on the shape of the BEL in comparison to the observed January 2006 Paβ line (solid lines). In all plots the BEL was modeled with the parameters which reproduce the Paβ line best. These are vrot = 1500 km s−1, σv, 2 (vrot sin i)−1 = 0, vrot,2 = 2500 km s−1, σφ,2 ≈ 0.45 rad and φC, 2 = 0.5 π. The parameters varied are shown in the legends at the top of each plot. In the upper left plot the changes due to different rotational velocities are shown. The middle left plot illustrates how increasing the local line broadening leads to a wider bump. A visualization of the influence of a changing rotational velocity of the additional clouds is given in the right plot in the middle. In the lower left plot different widths of g(φ) are shown. We note that the dotted line is shifted down and the dashed dotted line is shifted up by 0.2 × 10⁻¹⁵ erg (s cm−2 Å) for better visibility. Finally in the lower left plot the center of the additional clouds (φC, 2) is varied. These plots are not to be understood as fits to the data. Rather we want to explore how different parameters change the modeled BEL.
Current usage metrics show cumulative count of Article Views (full-text article views including HTML views, PDF and ePub downloads, according to the available data) and Abstracts Views on Vision4Press platform.
Data correspond to usage on the plateform after 2015. The current usage metrics is available 48-96 hours after online publication and is updated daily on week days.
Initial download of the metrics may take a while.


