Fig. 7.
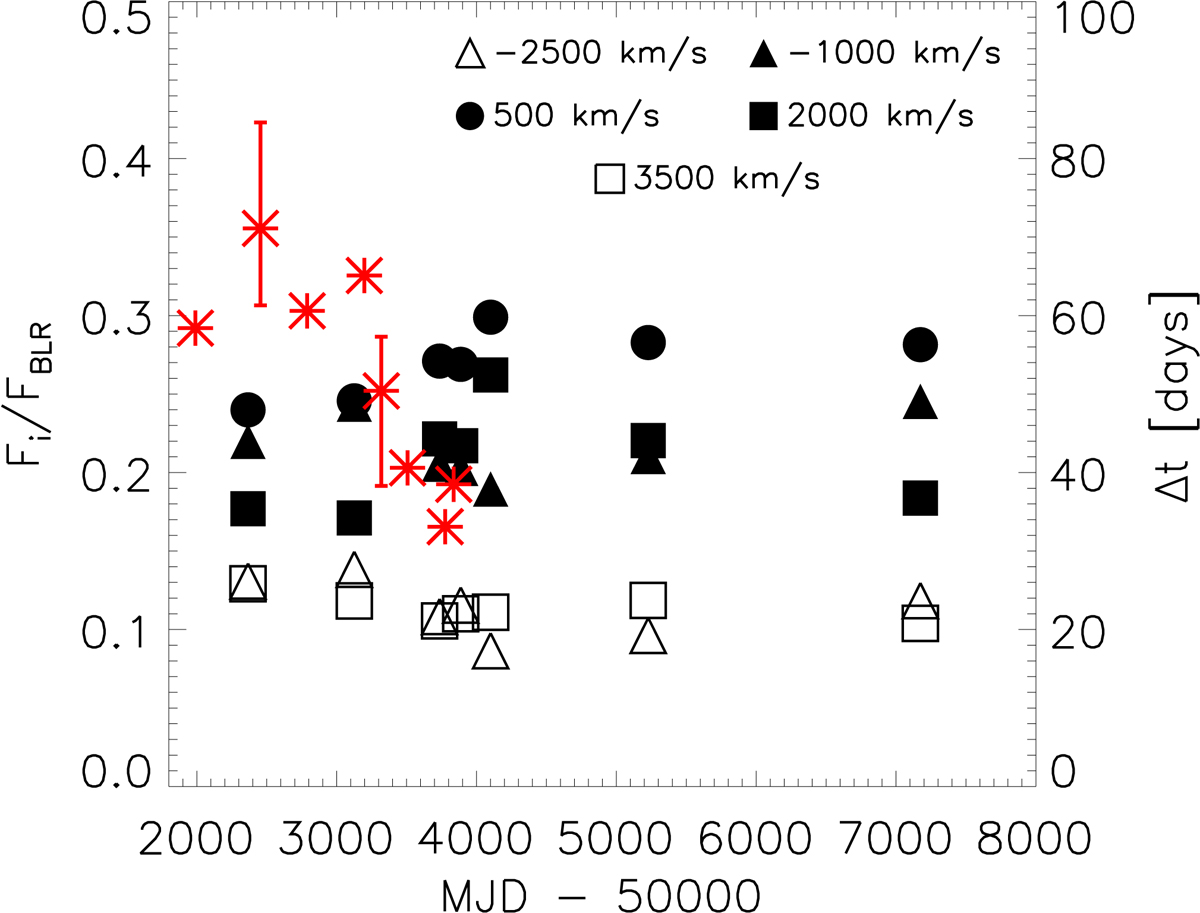
Fluxes in different velocity bins (Fij) over the total flux from the Paβ BEL (Fi) over time for the seven spectra. The different symbols indicate the different velocity bins which are also given at the bottom of Fig. 2 and their central velocity is given at the top of the plot. The error bars are smaller than the symbols except for two of dust radii where the error bars are given. Indicated with the red stars are the radii of the last five epochs determined by Koshida et al. (2009). For those the reverberation delay in ld is plotted against time. At the same time the radius of the dust torus is reduced by a factor of approximately two, and the relative flux in the bin between 1250 and 2750 km s−1 (orange crosses) increases significantly.
Current usage metrics show cumulative count of Article Views (full-text article views including HTML views, PDF and ePub downloads, according to the available data) and Abstracts Views on Vision4Press platform.
Data correspond to usage on the plateform after 2015. The current usage metrics is available 48-96 hours after online publication and is updated daily on week days.
Initial download of the metrics may take a while.