Fig. 6.
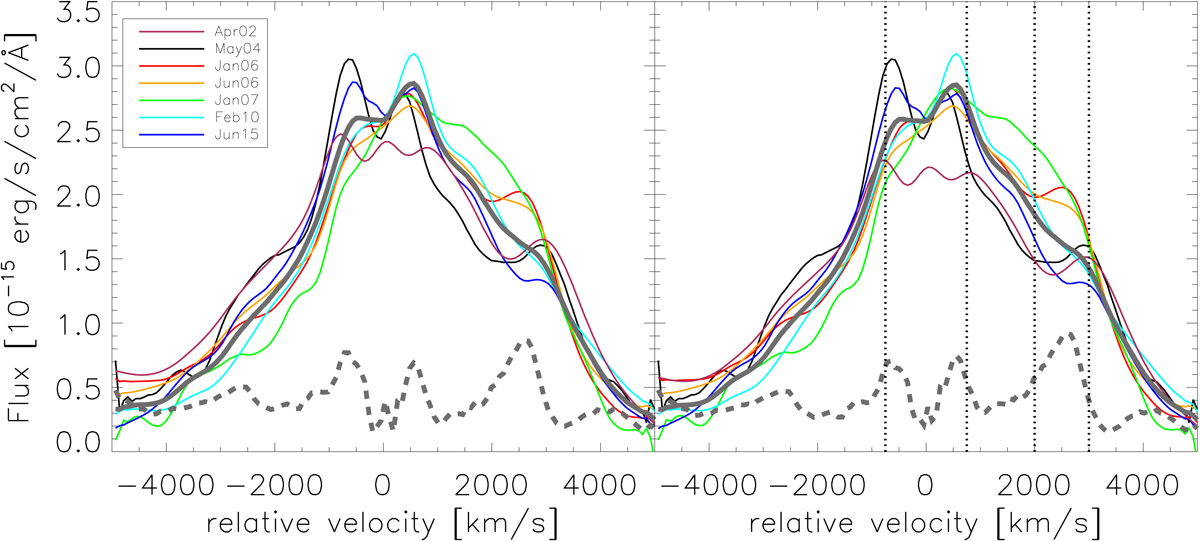
Paβ BELs normalized with the fit parameters from the rms minimization Eq. (1) which are given in Table 2. The color coding of the BELs is given in the upper left corner. Additionally the mean spectrum (solid gray line) and the rms profile (dashed gray line) are shown. For better visibility the rms profile was multiplied by a factor of three. In the left plot the full BEL was used for the rms minimization. In order to make the minimization less sensitive to the shape variations of the BEL the indicated velocity ranges between −750 to 750 km s−1 and 2000 and 3000 km s−1 were excluded from the minimization in the right plot as the rms profile is largest in these regions indicating the strongest shape variations.
Current usage metrics show cumulative count of Article Views (full-text article views including HTML views, PDF and ePub downloads, according to the available data) and Abstracts Views on Vision4Press platform.
Data correspond to usage on the plateform after 2015. The current usage metrics is available 48-96 hours after online publication and is updated daily on week days.
Initial download of the metrics may take a while.