Fig. 5.
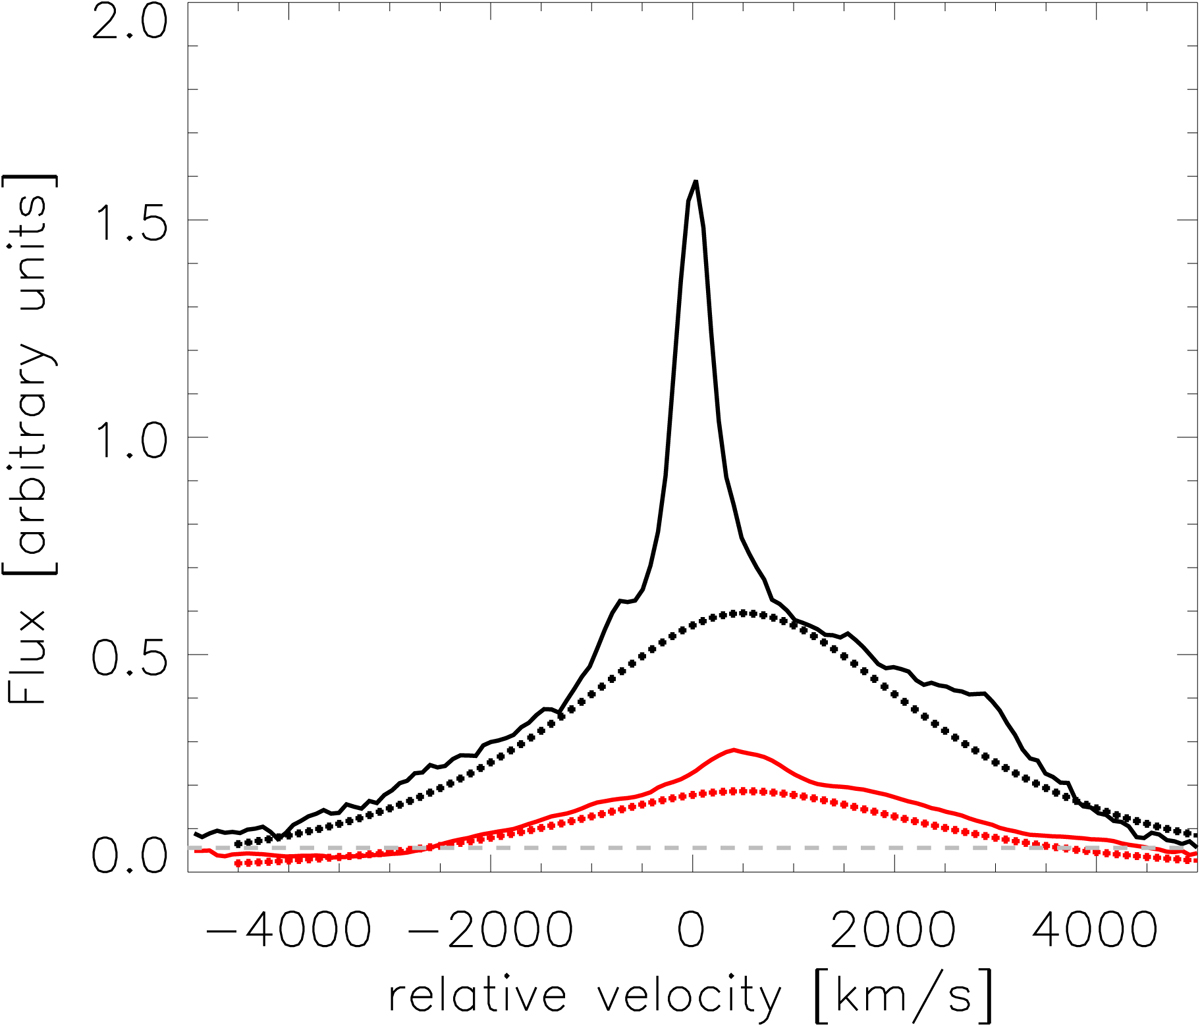
Mean (black solid line) and rms (red solid line) profile for the Paβ line of all spectra despite the April 2002 spectrum (which had to be excluded here due to its lower spectral resolution). Along with this a model of a symmetrical BEL was plotted which we develop in Sect. 4 (red and black dotted lines) based on Stern et al. (2015). The gray dashed line shows the median flux error of individual pixels at the Paβ line.
Current usage metrics show cumulative count of Article Views (full-text article views including HTML views, PDF and ePub downloads, according to the available data) and Abstracts Views on Vision4Press platform.
Data correspond to usage on the plateform after 2015. The current usage metrics is available 48-96 hours after online publication and is updated daily on week days.
Initial download of the metrics may take a while.