Fig. 2.
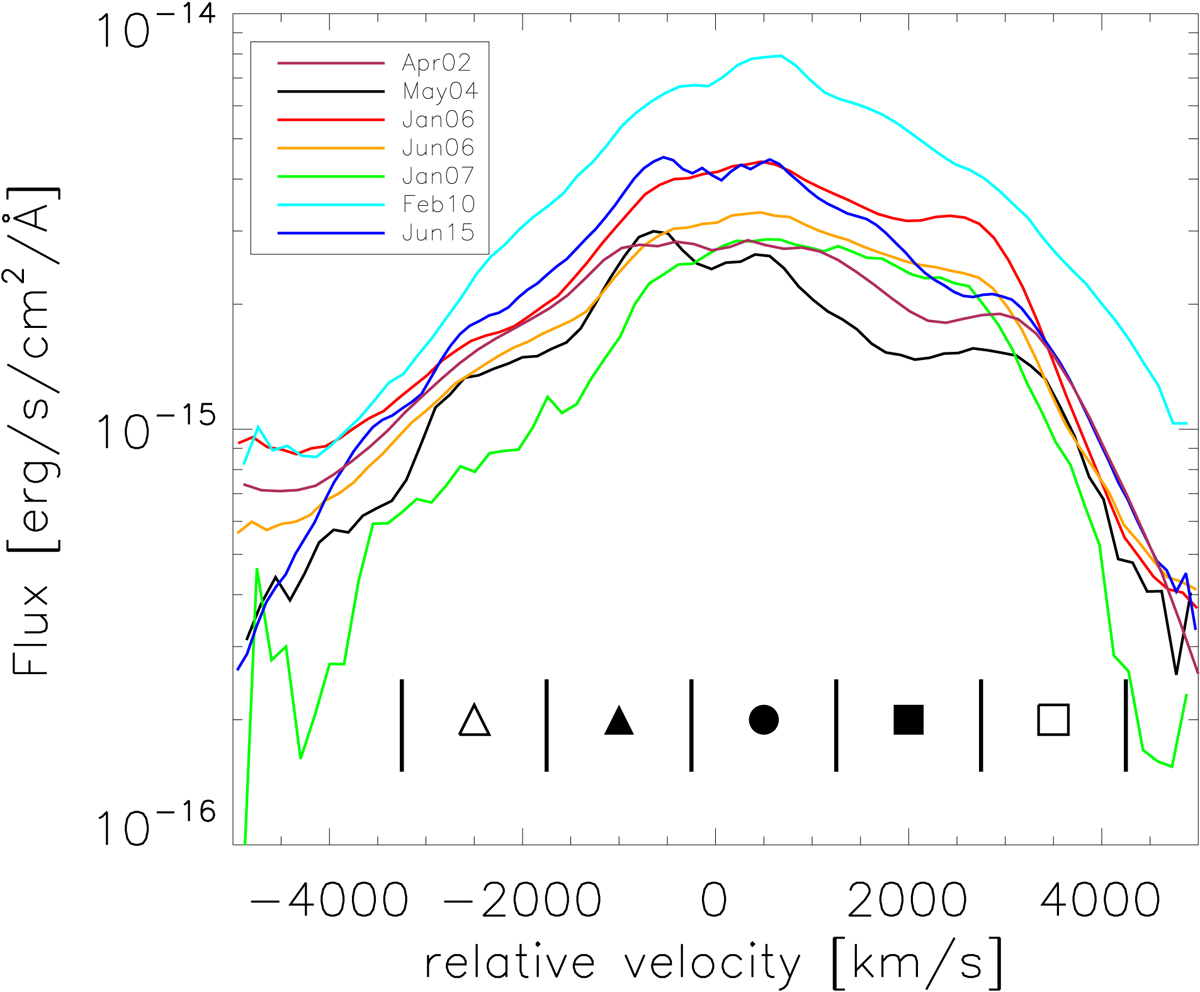
Paβ BEL for our seven observation epochs. The color coding for the epochs is shown in the upper left corner of the plot. The subtraction of the NEL and continuum flux are described in Sect. 2. Wiggles can be seen for most epochs approximately at the center of the BEL. We cannot rule out that these are residuals from the NEL subtraction. Therefore it is not possible to tell whether these shape variations originate in the BLR. At the bottom of the figure the velocity bins used for Fig. 7 are shown and color coded from blue to red. The strongest shape variations can be seen in the red shifted part of the BEL especially around velocities of 2500 km s−1.
Current usage metrics show cumulative count of Article Views (full-text article views including HTML views, PDF and ePub downloads, according to the available data) and Abstracts Views on Vision4Press platform.
Data correspond to usage on the plateform after 2015. The current usage metrics is available 48-96 hours after online publication and is updated daily on week days.
Initial download of the metrics may take a while.