Fig. 7.
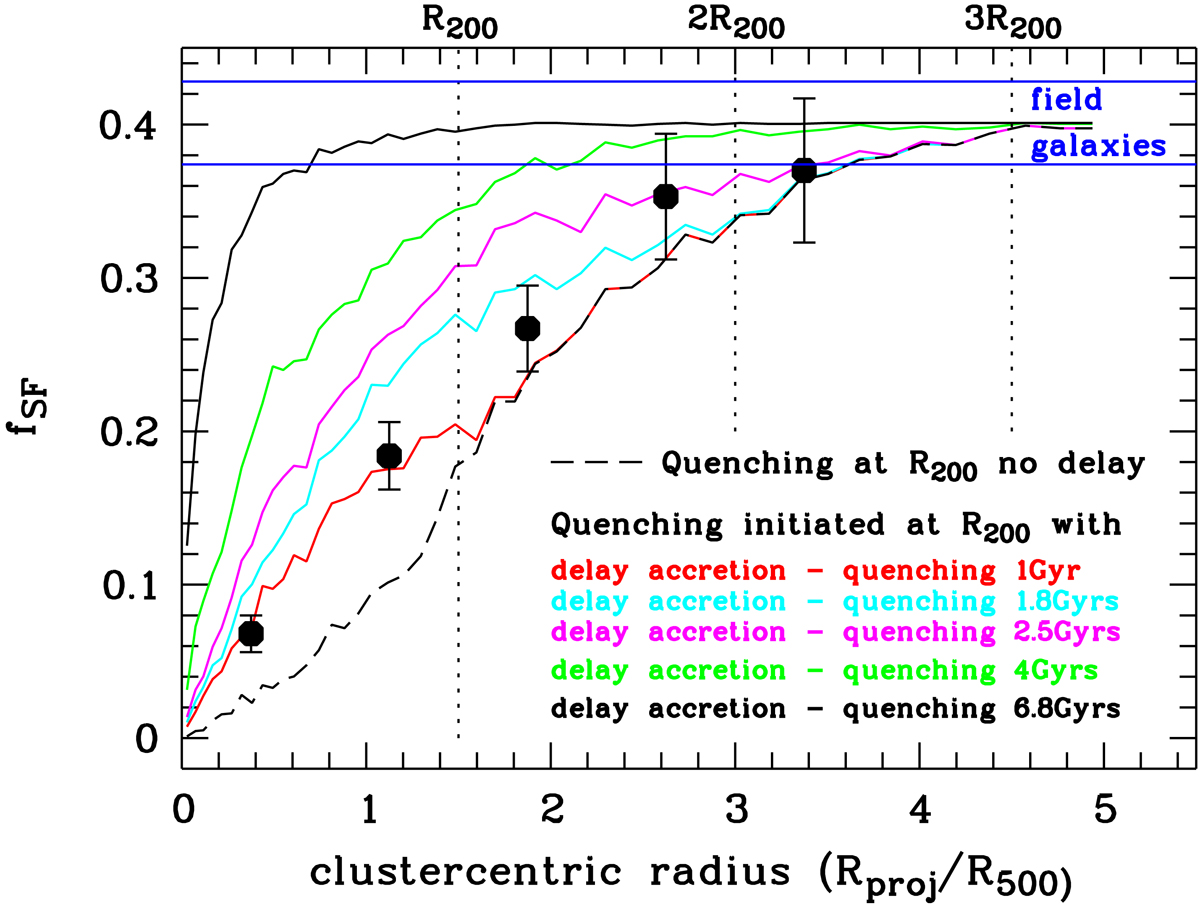
Comparison of the observed fraction of star-forming galaxies fSF as a function of clustercentric radius (based on the histograms shown in Fig. 3) with predictions from the Millennium cosmological simulation. The black filled circles show the observed fraction of star-forming cluster galaxies in the LoCuSS mass-complete sample. Each galaxy is weighted by the inverse probability of it having being observed spectroscopically, following the approach of Norberg et al. (2002). The black dashed line shows the predicted star formation-radius relation using 75 massive clusters in the Millennium simulation, assuming that star formation is immediately quenched upon being accreted by the cluster, i.e., passing the physical R200 for the first time. The additional (colored) solid curves show the effects of delaying the complete quenching by a time Δt after the galaxy is accreted into the cluster (i.e., passing R200 for the first time), corresponding to the delayed-then-rapid quenching scenario of Wetzel et al. (2013) or to a slow-then-rapid model as discussed in Sect. 4.4. The comparison of the observed fractions with the model curves derived from the Millennium simulation implies Δt ∼ 1 − 2 Gyr.
Current usage metrics show cumulative count of Article Views (full-text article views including HTML views, PDF and ePub downloads, according to the available data) and Abstracts Views on Vision4Press platform.
Data correspond to usage on the plateform after 2015. The current usage metrics is available 48-96 hours after online publication and is updated daily on week days.
Initial download of the metrics may take a while.