Fig. 4.
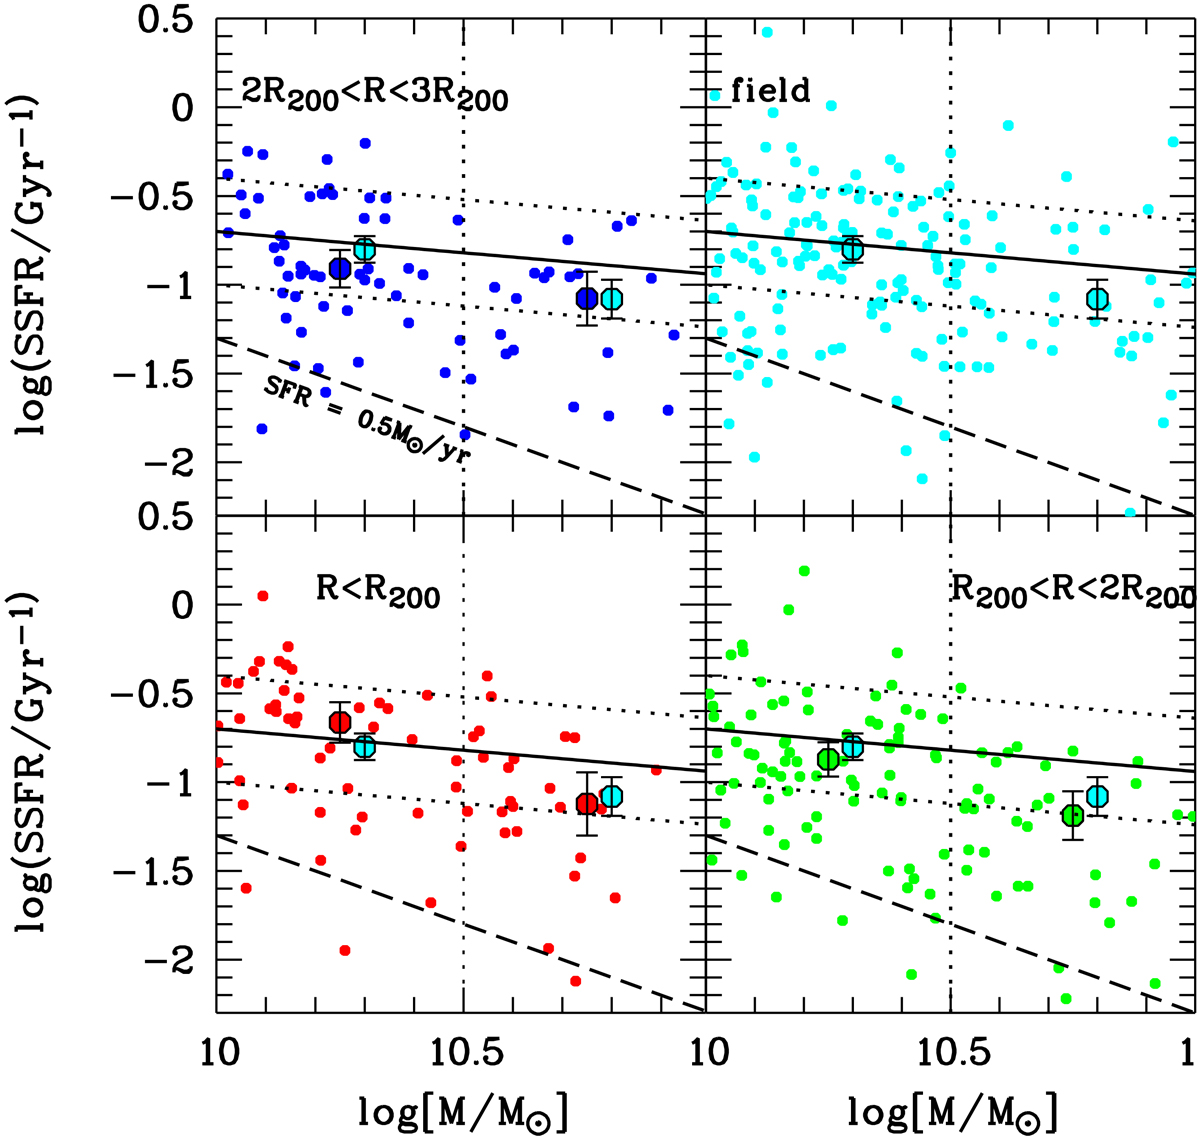
Mass−SSFR relation for 259 cluster and 169 field galaxies in the OHgals mass-complete sample for three regions at different distances from the cluster center (red, green, and blue) and field galaxies (cyan). The oblique solid line shows the MS at z ∼ 0.2 and its dispersion (indicated by the dotted lines) using Eq. (1) in Peng et al. (2010). The dashed oblique line in each panel shows that galaxies in our OHgals sample have typically SFRs > 0.5 M⊙ yr−1. The median SSFRs in the Mhigh and in the Mlow mass bins are shown as big filled circles, with the field median values (cyan symbols) shown in all panels (slightly displaced in mass compared to cluster galaxies for visibility of the median symbols). In a given mass bin the median SSFR values of field and cluster galaxies are consistent.
Current usage metrics show cumulative count of Article Views (full-text article views including HTML views, PDF and ePub downloads, according to the available data) and Abstracts Views on Vision4Press platform.
Data correspond to usage on the plateform after 2015. The current usage metrics is available 48-96 hours after online publication and is updated daily on week days.
Initial download of the metrics may take a while.