Fig. 3.
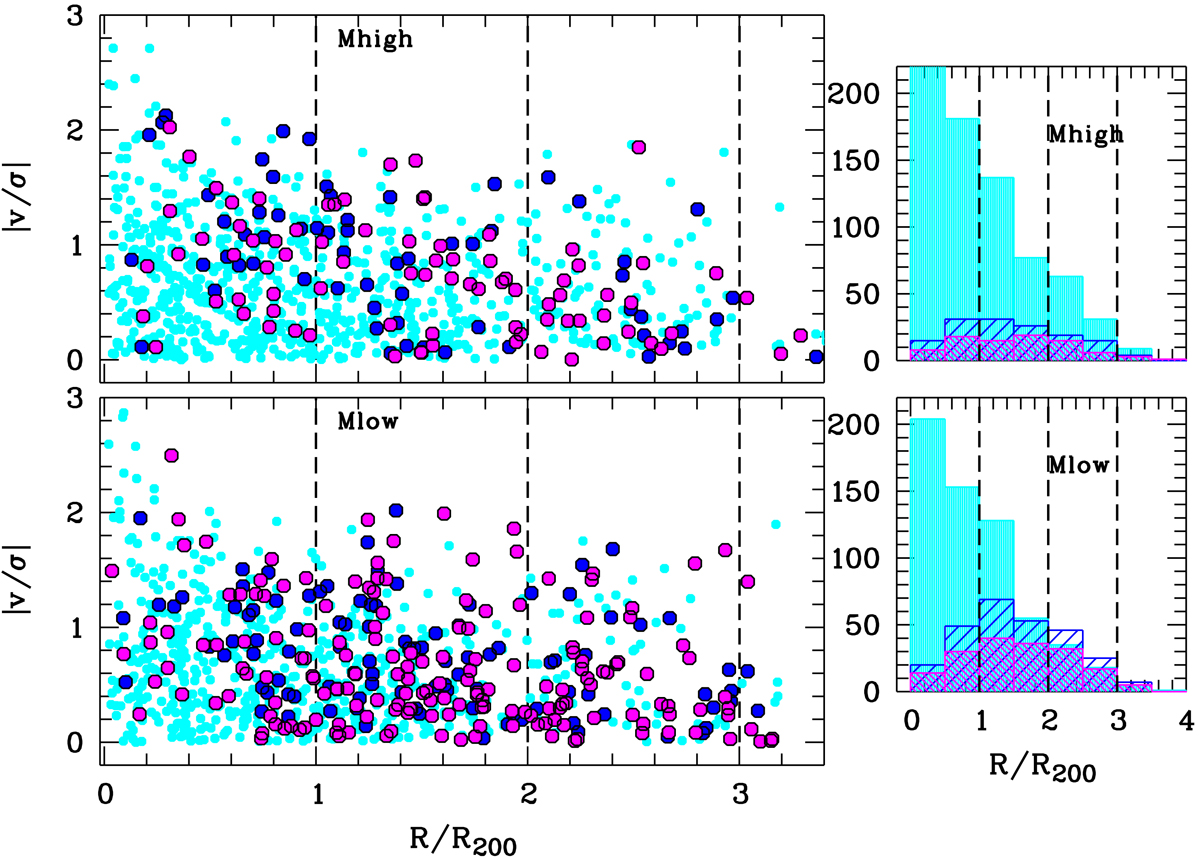
Phase-space diagram showing cluster SFgals (blue), nonSFgals (cyan), and OHgals (magenta) objects with 10 ≤ log(M/M⊙)≤11. The histograms on the right for the different subsamples as a function of clustercentric radius are used to compute the observed fraction of star-forming galaxies and constrain quenching timescales by comparing with the Millennium simulation (cf. Fig. 7). The star-forming galaxies at R < R200 (magenta and blue symbols) have in general higher line-of-sight velocities than non-star-forming galaxies; this is indicative that these galaxies are an infalling population.
Current usage metrics show cumulative count of Article Views (full-text article views including HTML views, PDF and ePub downloads, according to the available data) and Abstracts Views on Vision4Press platform.
Data correspond to usage on the plateform after 2015. The current usage metrics is available 48-96 hours after online publication and is updated daily on week days.
Initial download of the metrics may take a while.