Fig. 2.
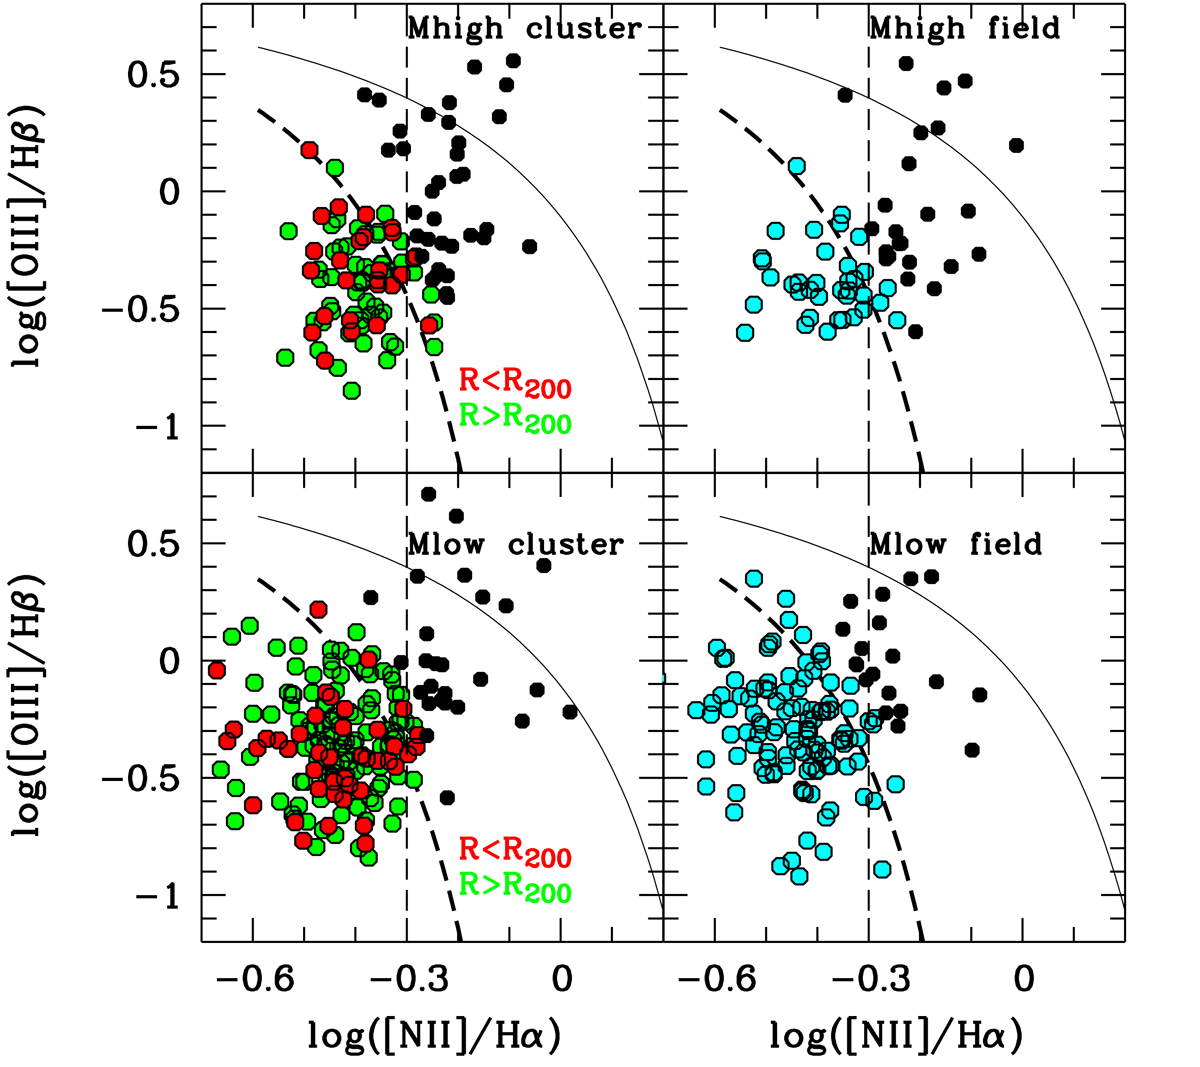
Diagnostic diagram BPT (Baldwin et al. 1981) to distinguish star formation-dominated galaxies from AGNs for the mass-complete cluster and field galaxy samples. The star-forming region of the BPT diagram has 259 cluster galaxies and 169 field galaxies (OHgals sample, red, green and cyan points), lying under and to the left of the empirical (dashed) curve of Kauffmann et al. (2003). We also include in the OHgals sample a few objects above and up to a maximum of 0.3 dex to the right of the Kauffmann et al. (2003) curve to take error bars of the flux measurements into account and to mimimize the number of excluded composite galaxies above but close to the demarcation line that are likely to have their Hα line mostly produced by star formation. The red symbols show the subsample of OHgals with R < R200. Mlow (Mhigh) galaxies shown as black symbols in the lower (upper) panels lie in the region occupied by AGN and composite galaxies (CompAGNs sample, see Table 2), with composites lying between the empirical dashed curve of Kauffmann et al. (2003) and the theoretical solid curve of Kewley (2001). The vertical dashed line at log([NII]//Hα) = − 0.3 shows the demarcation line for selecting SeyfLiners galaxies (log([NII]/Hα) > − 0.3) using the criterium of Cid Fernandes et al. (2011), see Fig. 1.
Current usage metrics show cumulative count of Article Views (full-text article views including HTML views, PDF and ePub downloads, according to the available data) and Abstracts Views on Vision4Press platform.
Data correspond to usage on the plateform after 2015. The current usage metrics is available 48-96 hours after online publication and is updated daily on week days.
Initial download of the metrics may take a while.