Fig. 5
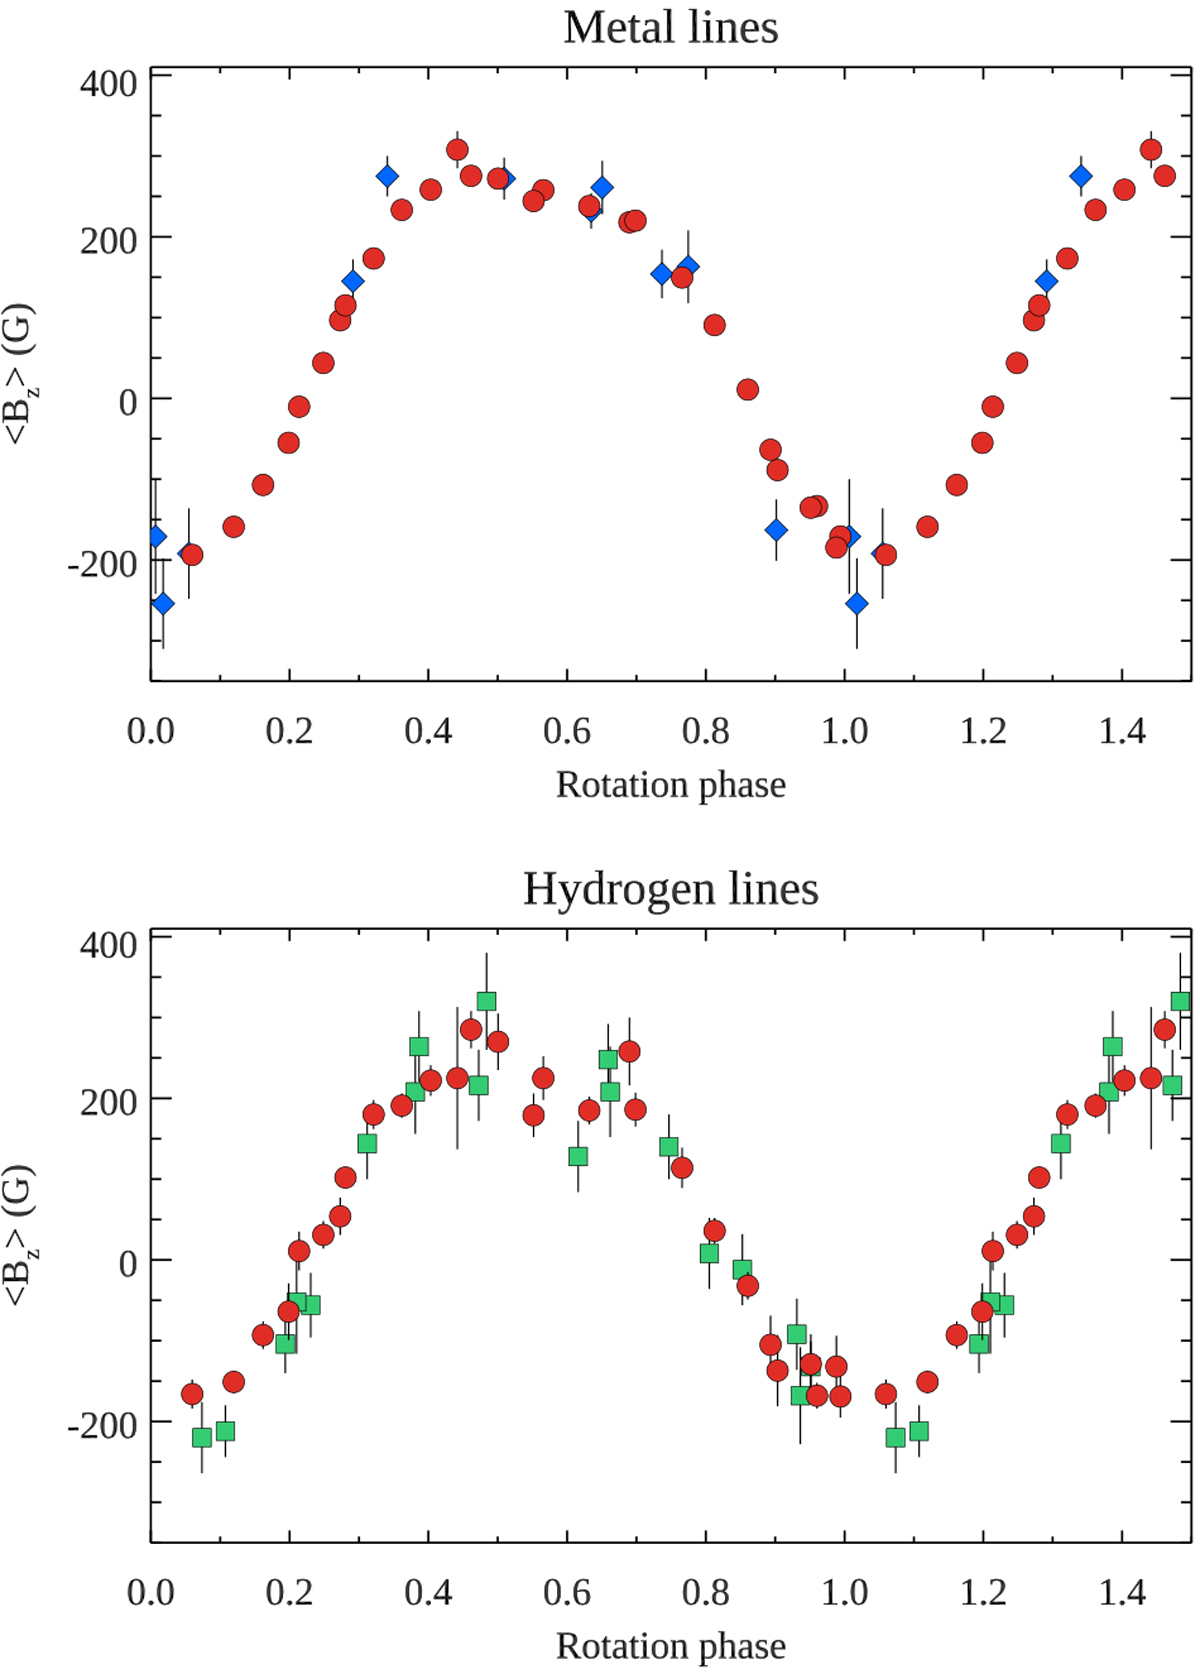
Longitudinal magnetic field of θ Aur as a function of rotational phase. Top panel: compares the LSD metal line measurements by Wade et al. (2000, blue diamonds) with the results obtained in our study (red circles). Bottom panel: compares our Balmer line ⟨Bz ⟩ estimates (red circles) with the photopolarimetric measurements by Borra & Landstreet (1980, green squares) corrected by a factor of 4/5.
Current usage metrics show cumulative count of Article Views (full-text article views including HTML views, PDF and ePub downloads, according to the available data) and Abstracts Views on Vision4Press platform.
Data correspond to usage on the plateform after 2015. The current usage metrics is available 48-96 hours after online publication and is updated daily on week days.
Initial download of the metrics may take a while.