Fig. B.1
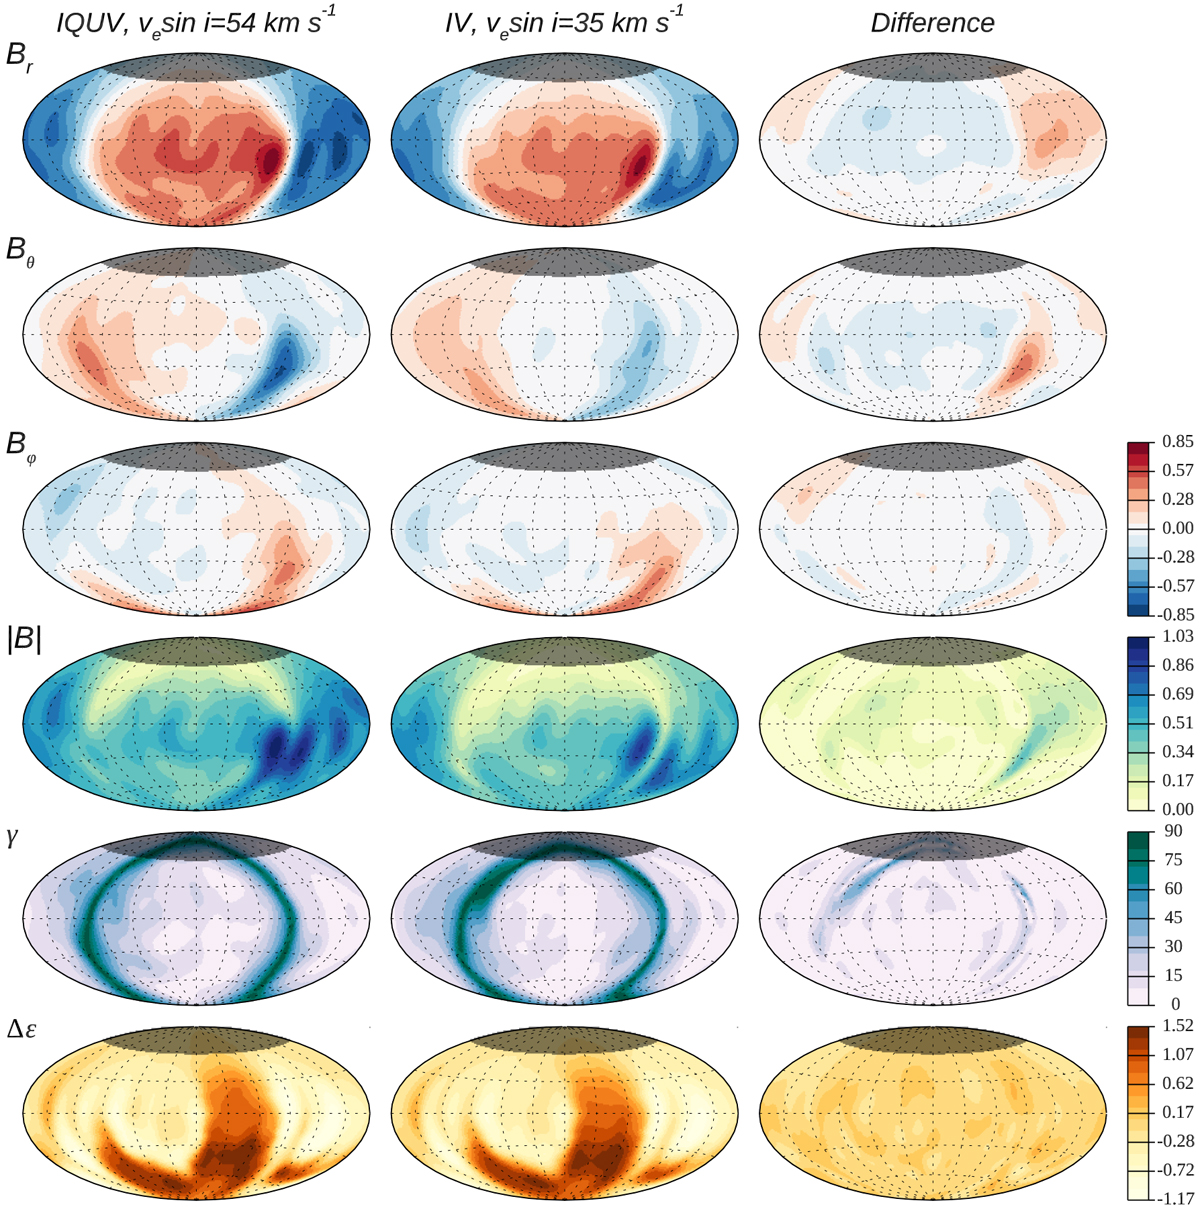
Comparison of the Cr four Stokes parameter ZDI results for θ Aur (left column) with the Stokes IV inversion (middle column) from the spectra simulated for ve sini = 35 km s−1 and the same surface abundance and magnetic field distributions. Right column: difference between the two sets of maps. The rows correspond to, from top to bottom, the radial, meridional, and azimuthal magnetic field components, the field modulus, the field inclination angle, and the relative Cr abundance. The side colour bars give the scale in kG for the magnetic field maps, in degrees for the field inclination, and in Δ log (NCr∕Ntot) units for the Cr abundance distribution. The shaded part of stellar surface in the upper part of each map is invisible to the observer.
Current usage metrics show cumulative count of Article Views (full-text article views including HTML views, PDF and ePub downloads, according to the available data) and Abstracts Views on Vision4Press platform.
Data correspond to usage on the plateform after 2015. The current usage metrics is available 48-96 hours after online publication and is updated daily on week days.
Initial download of the metrics may take a while.