Fig. 1
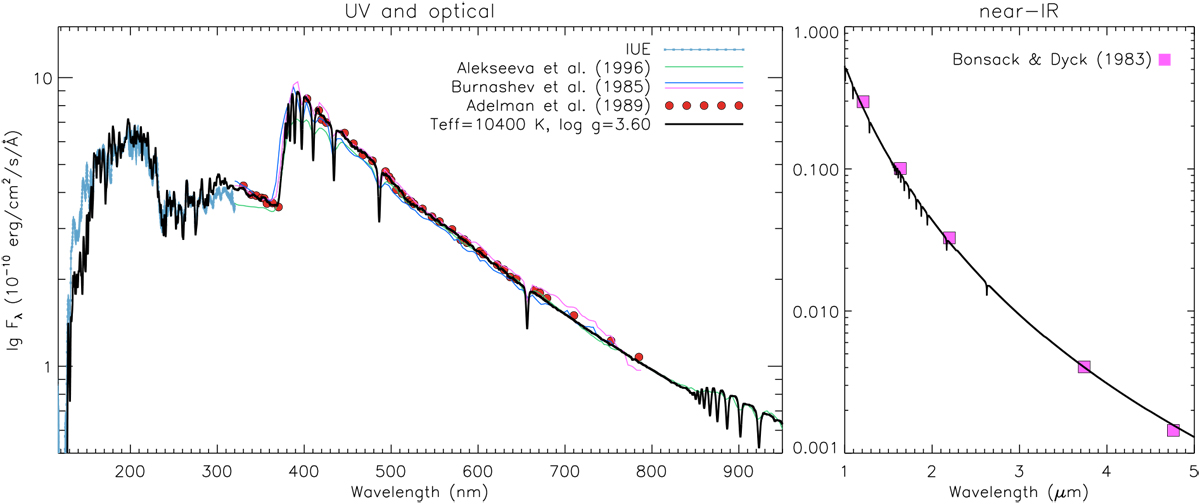
Comparison of the observed and computed spectral energy distributions of θ Aur in the UV and optical (left panel) and near-IR (right panel). The sources of the observed spectrophotometry are indicated in the legends. The thick black line shows the best-fitting theoretical SED corresponding to Teff = 10400 K, log g = 3.6, and θ = 0.85 mas.
Current usage metrics show cumulative count of Article Views (full-text article views including HTML views, PDF and ePub downloads, according to the available data) and Abstracts Views on Vision4Press platform.
Data correspond to usage on the plateform after 2015. The current usage metrics is available 48-96 hours after online publication and is updated daily on week days.
Initial download of the metrics may take a while.