Fig. 8
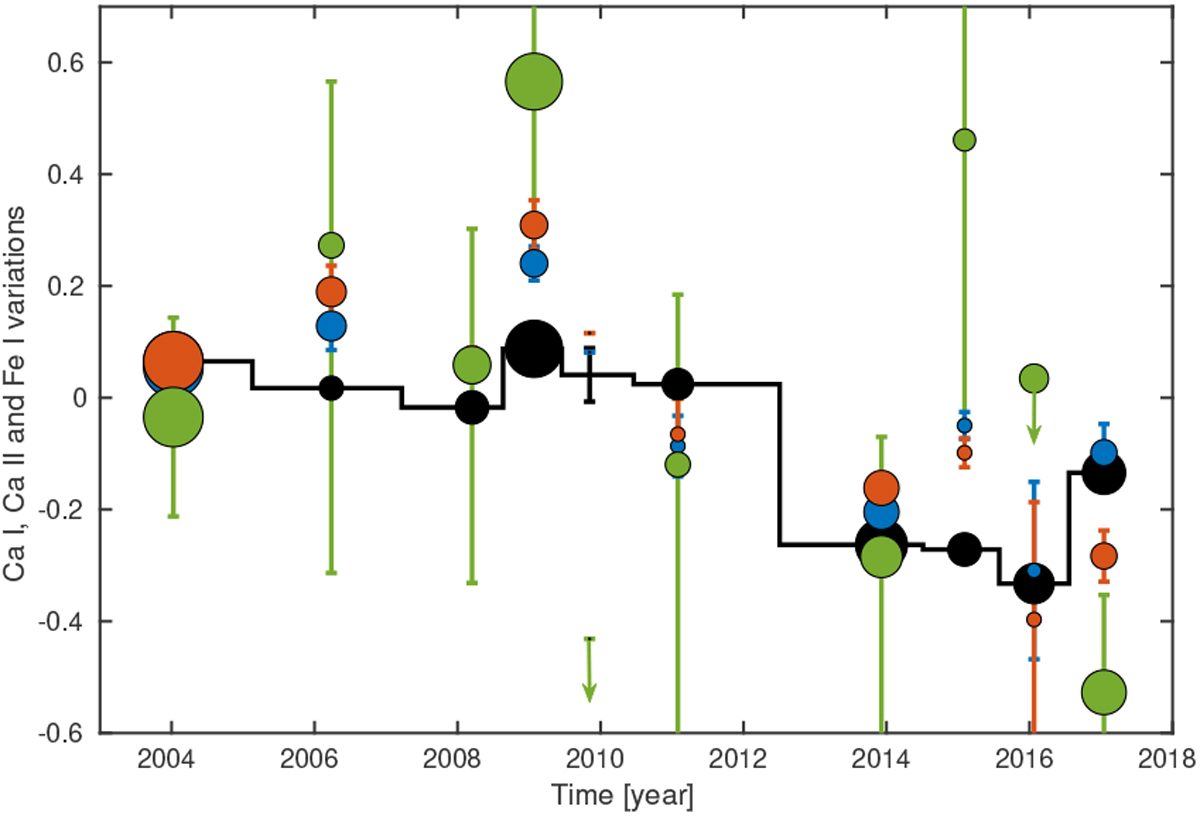
Scaled-to-median Ca I column density variations at 4226.728 Å, in green, compared to Ca II-K (in blue), Ca II-H (in red) and Fe I variations (black). Absolute values for Ca I column densities are reported in Table 8. The median of all datasets was shifted to 0. The size is proportional to the number of observed nights for Ca II, while it is proportional to S/N for Fe I and Ca I, as given in Tables 7, 4, and 8, respectively.
Current usage metrics show cumulative count of Article Views (full-text article views including HTML views, PDF and ePub downloads, according to the available data) and Abstracts Views on Vision4Press platform.
Data correspond to usage on the plateform after 2015. The current usage metrics is available 48-96 hours after online publication and is updated daily on week days.
Initial download of the metrics may take a while.