Fig. 6
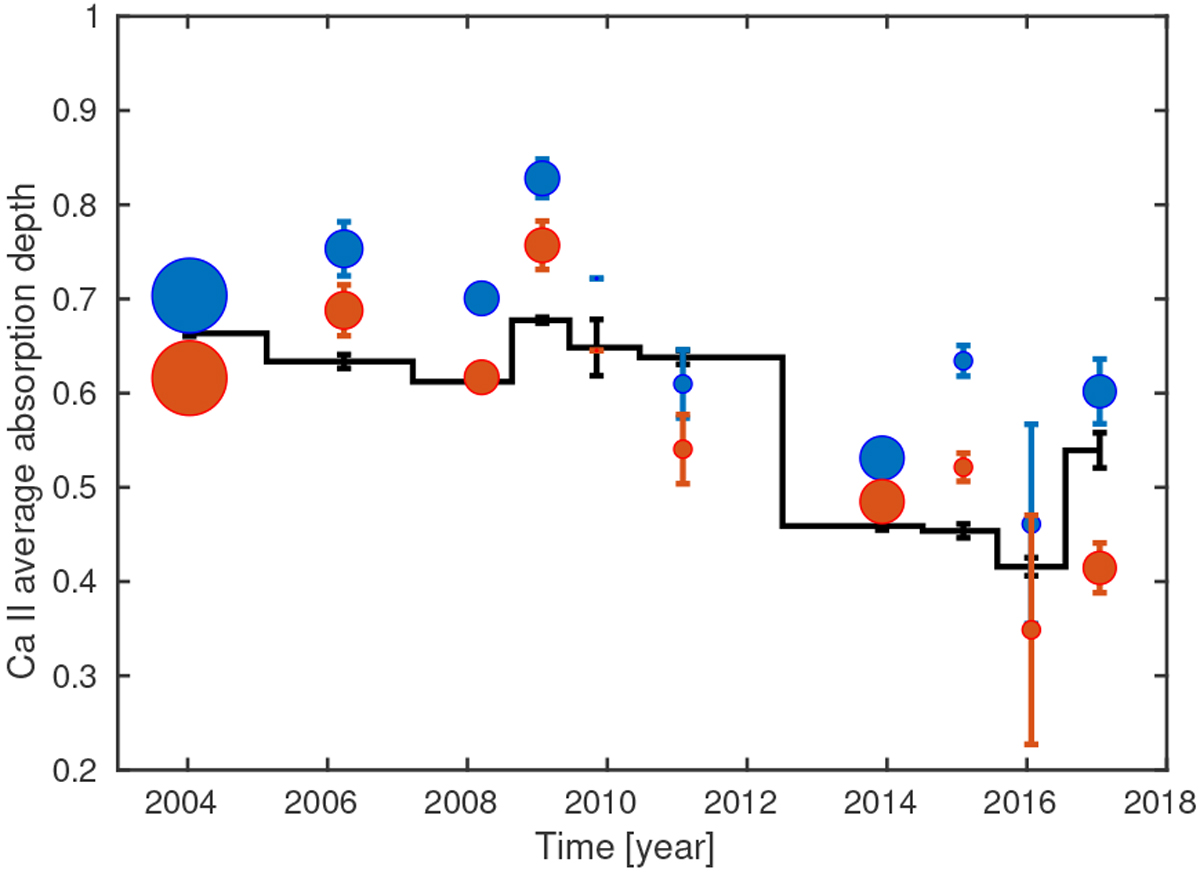
Average absorption depth (AAD) variations in the Ca II circumstellar line region 0 ± 5 km s−1. In blue, the K-line AAD and in red the H-line. They are compared to the total Fe I ground level column density variations in Table 4. The marker size is proportionnal to the number of nights where β Pic was observed by HARPS in each period (see Table 1). For the sake of comparison, the Fe I column densities arescaled to the Ca II AAD median.
Current usage metrics show cumulative count of Article Views (full-text article views including HTML views, PDF and ePub downloads, according to the available data) and Abstracts Views on Vision4Press platform.
Data correspond to usage on the plateform after 2015. The current usage metrics is available 48-96 hours after online publication and is updated daily on week days.
Initial download of the metrics may take a while.