Fig. 2.
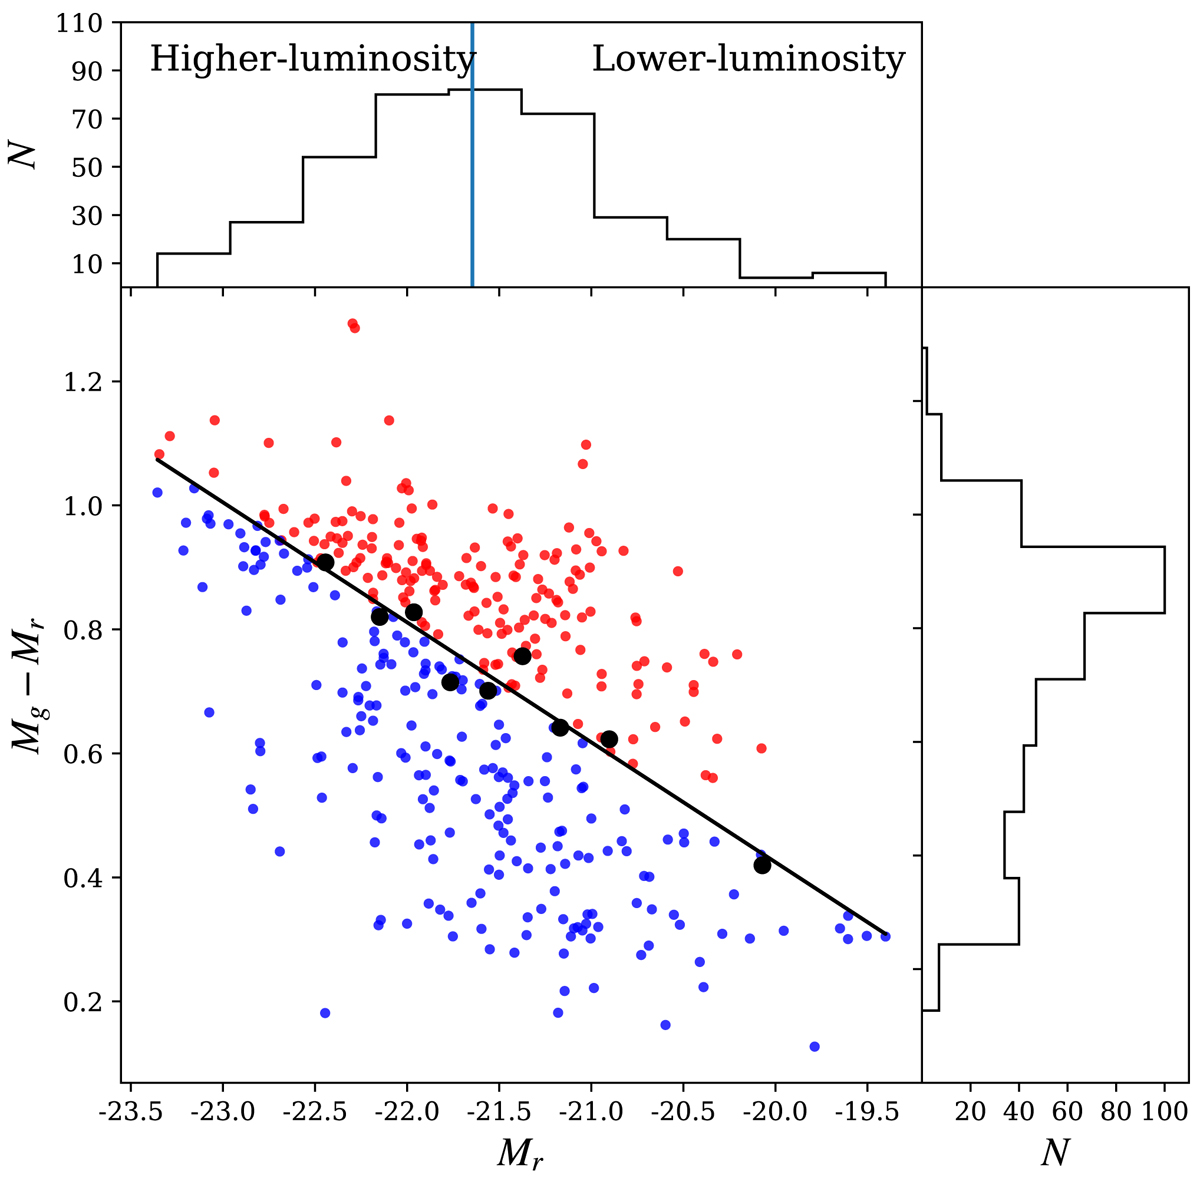
Red and blue pairs classification criterion (central panel): Mg − Mr vs. Mr, where Mg and Mr are the total absolute magnitudes of the pairs in g−band and r−band, respectively. We divide the sample into 10 percentiles in magnitude Mr and then we compute the median color in each percentile (black dots). Subsequently, we fit a linear function (black line) to the obtained points and select the pairs with larger colors as red pairs and with lower colors as blue pairs. Upper and lower panels: total absolute magnitude and total color distributions of the pairs. The vertical blue line in the absolute magnitude distribution corresponds to the median value of this distribution, which is considered to classify higher- and lower-luminosity pairs.
Current usage metrics show cumulative count of Article Views (full-text article views including HTML views, PDF and ePub downloads, according to the available data) and Abstracts Views on Vision4Press platform.
Data correspond to usage on the plateform after 2015. The current usage metrics is available 48-96 hours after online publication and is updated daily on week days.
Initial download of the metrics may take a while.