Fig. 1.
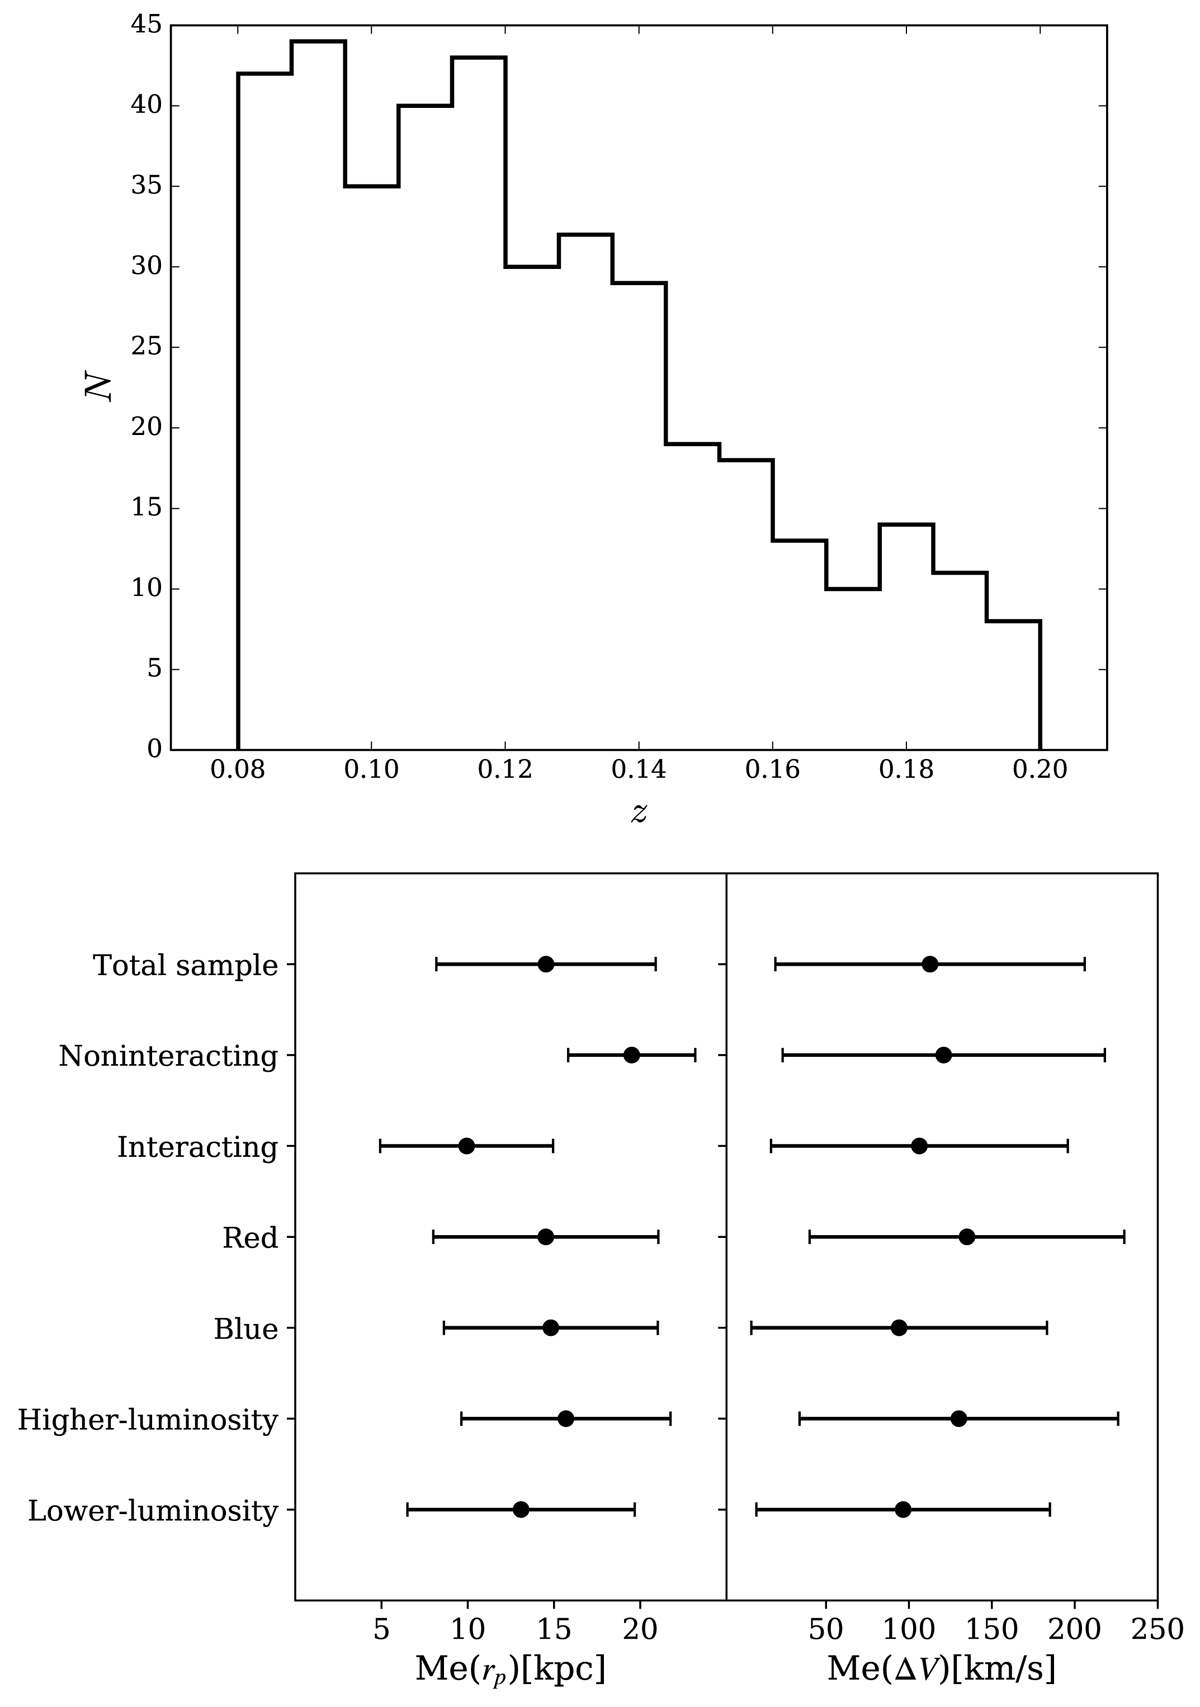
Upper panel: redshift distribution of the total sample of galaxy pairs. Lower panel: median projected distances, Me(rp), and median radial velocity difference, Me(ΔV), for the different galaxy pair classes. Error bars corresponds to the standard deviations of rp and ΔV distributions obtained for each class. Noninteracting pairs tend to have larger rp distances than interacting pairs. On the other hand, rp distributions for red and blue pairs, as well as higher- and lower-luminosity pairs, are all in agreement with the total sample rp distribution.
Current usage metrics show cumulative count of Article Views (full-text article views including HTML views, PDF and ePub downloads, according to the available data) and Abstracts Views on Vision4Press platform.
Data correspond to usage on the plateform after 2015. The current usage metrics is available 48-96 hours after online publication and is updated daily on week days.
Initial download of the metrics may take a while.