Fig. 6
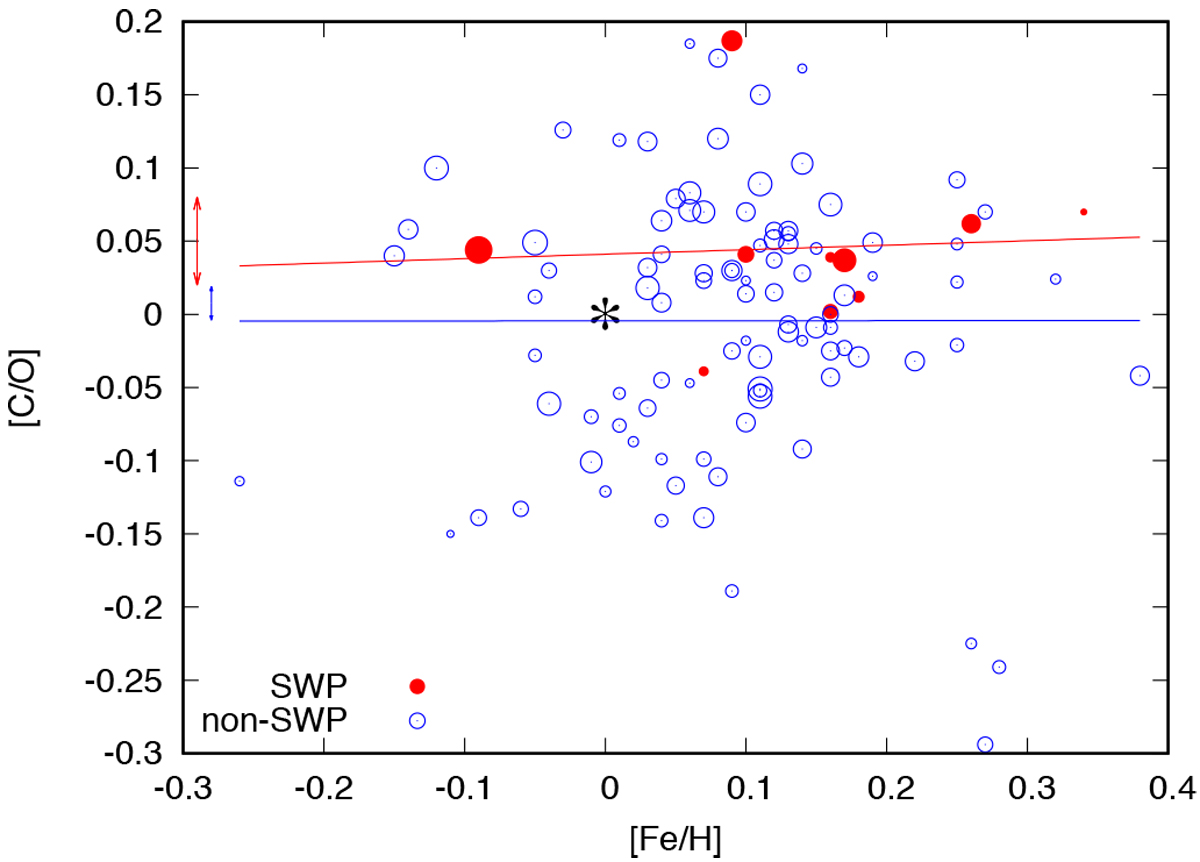
Dependence [C/O] vs. [Fe/H]. The SWP are shown with red circles. Larger circles indicate the stars of larger masses. Error bars from the determinations of the mean [C/O] in the samples of SWP and non-SWP are shown by the red and blue arrows. Linear approximation results for the SWP and non-SWP stars shown by red ([C/O] = ((−0.576 ± 0.273) ⋅ [Fe∕H] + 0.047 ± 0.0158) and blue ([C/O] = (0.759 ± 0.077) ⋅ [Fe∕H] + 0.0079 ± 0.006) lines, respectively.
Current usage metrics show cumulative count of Article Views (full-text article views including HTML views, PDF and ePub downloads, according to the available data) and Abstracts Views on Vision4Press platform.
Data correspond to usage on the plateform after 2015. The current usage metrics is available 48-96 hours after online publication and is updated daily on week days.
Initial download of the metrics may take a while.