Fig. 9.
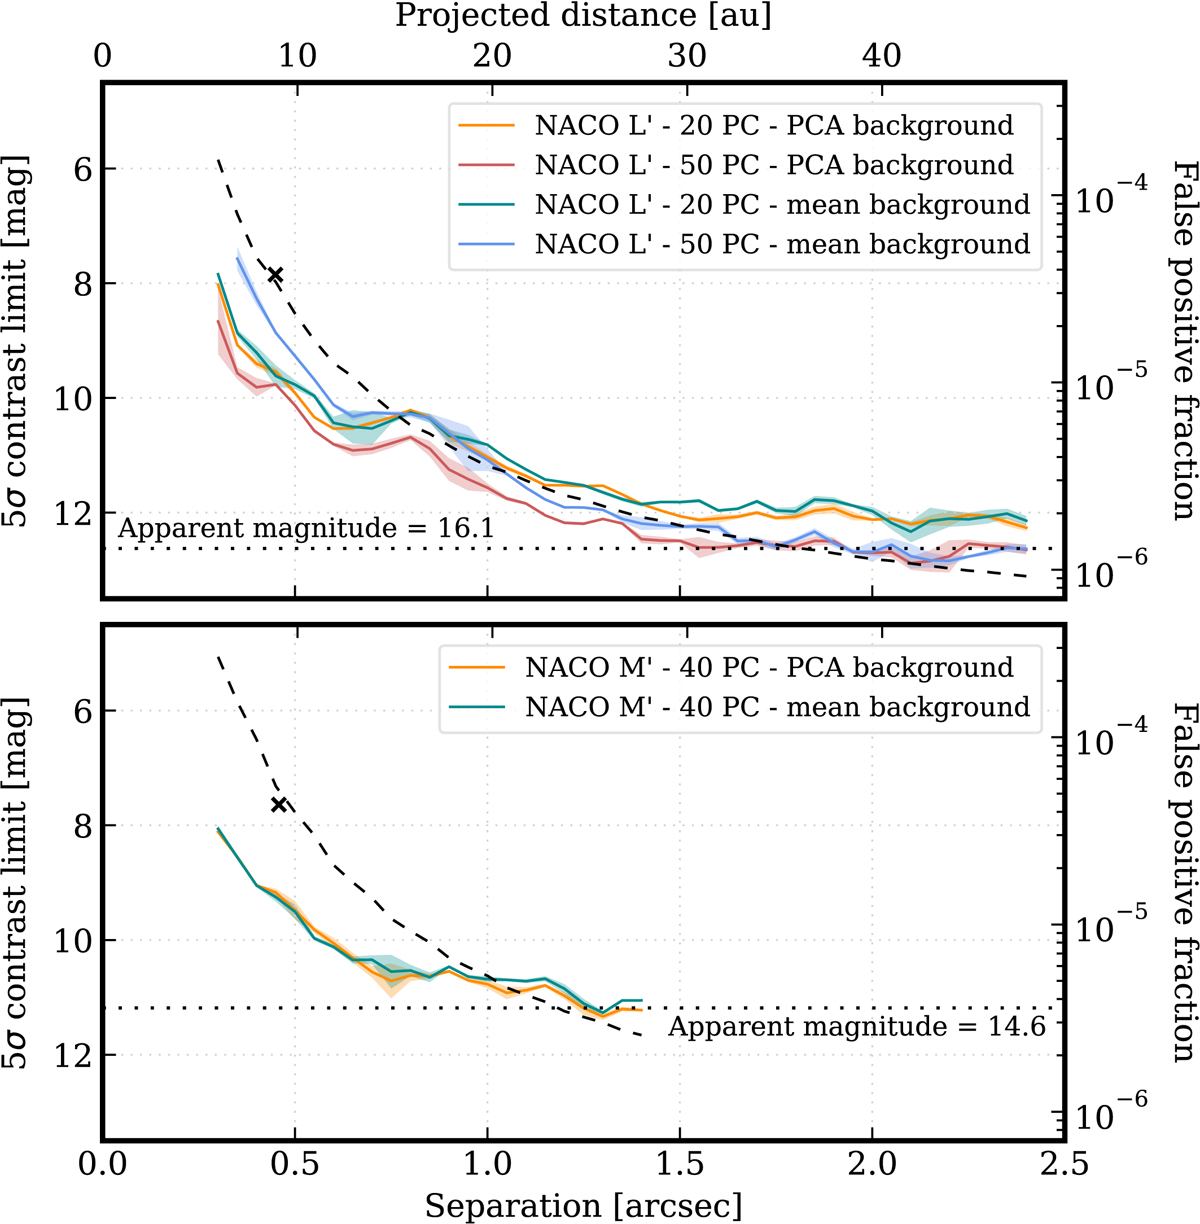
Detection limits in the NACO L′ (top panel) and M′ (bottom panel) filters. Solid lines are the azimuthally averaged limits and the shaded areas are the variance of the six azimuthal positions. The limits are calculated with a mean and PCA-based background subtraction for both filters. A range of PCs was tested but only the limits with the highest sensitivity are presented. The black dashed lines show the false positive fraction (right axis) associated with the detection limits and the horizontally dotted lines indicate the apparent magnitude in the background-limited regime. The black crosses show the separation and contrast of β Pic b as determined with the MCMC analysis (the uncertainties are smaller than the symbol size).
Current usage metrics show cumulative count of Article Views (full-text article views including HTML views, PDF and ePub downloads, according to the available data) and Abstracts Views on Vision4Press platform.
Data correspond to usage on the plateform after 2015. The current usage metrics is available 48-96 hours after online publication and is updated daily on week days.
Initial download of the metrics may take a while.