Fig. 5.
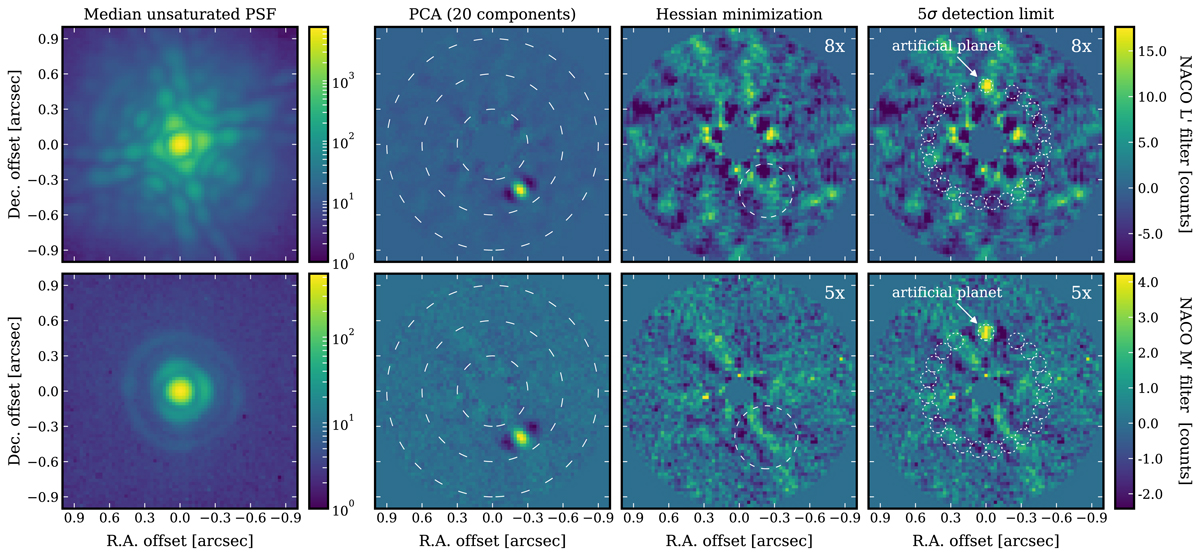
Analysis of archival VLT/NACO data of β Pictoris in the L′ (top row) and M′ (bottom row) filters. Images show from left to right the median unsaturated PSF of β Pic, the median residuals of the PSF subtraction, the residuals with the best-fit negative artificial planet injected, and the residuals with an artificial planet injected at ![]() and a brightness scaled to a 5σ detection level (i.e., a false positive fraction of 3.97 × 10⁻⁵ at that separation). All residuals were obtained by fitting the images with 20 PCs. The dashed circles in the second column are there to guide the eye, the dashed circles in third column denote the aperture size that was used for the minimization, and the dotted circles in the fourth column show the position and size of the detection and reference apertures. The reference apertures are used to estimate the noise at the separation of the artificial planet. The unsaturated images and the PSF subtraction residuals are displayed on a logarithmic and linear color scale, respectively. The unsaturated flux is shifted by a few counts such that the minimum value is unity. The dynamical range of the minimization and detection limits residuals is enhanced by the factor in the top right corner of each image, compared to the color bars on the right. North is up and east is to the left in all post-processed images.
and a brightness scaled to a 5σ detection level (i.e., a false positive fraction of 3.97 × 10⁻⁵ at that separation). All residuals were obtained by fitting the images with 20 PCs. The dashed circles in the second column are there to guide the eye, the dashed circles in third column denote the aperture size that was used for the minimization, and the dotted circles in the fourth column show the position and size of the detection and reference apertures. The reference apertures are used to estimate the noise at the separation of the artificial planet. The unsaturated images and the PSF subtraction residuals are displayed on a logarithmic and linear color scale, respectively. The unsaturated flux is shifted by a few counts such that the minimum value is unity. The dynamical range of the minimization and detection limits residuals is enhanced by the factor in the top right corner of each image, compared to the color bars on the right. North is up and east is to the left in all post-processed images.
Current usage metrics show cumulative count of Article Views (full-text article views including HTML views, PDF and ePub downloads, according to the available data) and Abstracts Views on Vision4Press platform.
Data correspond to usage on the plateform after 2015. The current usage metrics is available 48-96 hours after online publication and is updated daily on week days.
Initial download of the metrics may take a while.