Fig. 7.
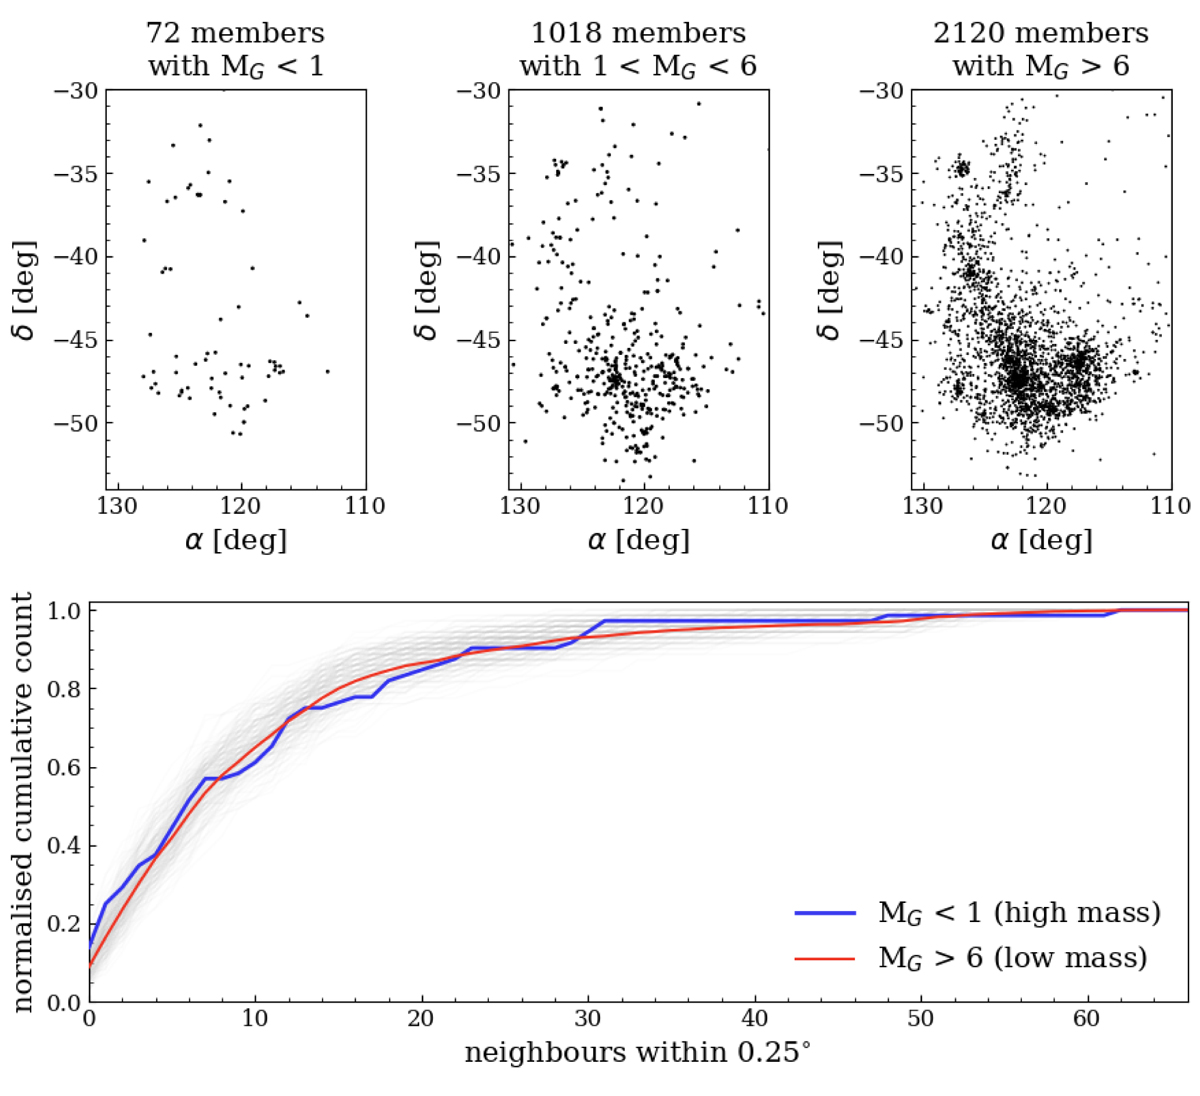
Top row: spatial distributions of stars in three different absolute magnitude ranges. Bottom panel: normalised cumulative distribution of the local density (number of neighbours within a fixed radius) for the 72 high-mass stars (blue) and 2120 low-mass stars (red). The grey curves correspond to 200 random re-drawings of 72 points from the total sample.
Current usage metrics show cumulative count of Article Views (full-text article views including HTML views, PDF and ePub downloads, according to the available data) and Abstracts Views on Vision4Press platform.
Data correspond to usage on the plateform after 2015. The current usage metrics is available 48-96 hours after online publication and is updated daily on week days.
Initial download of the metrics may take a while.