Fig. 6.
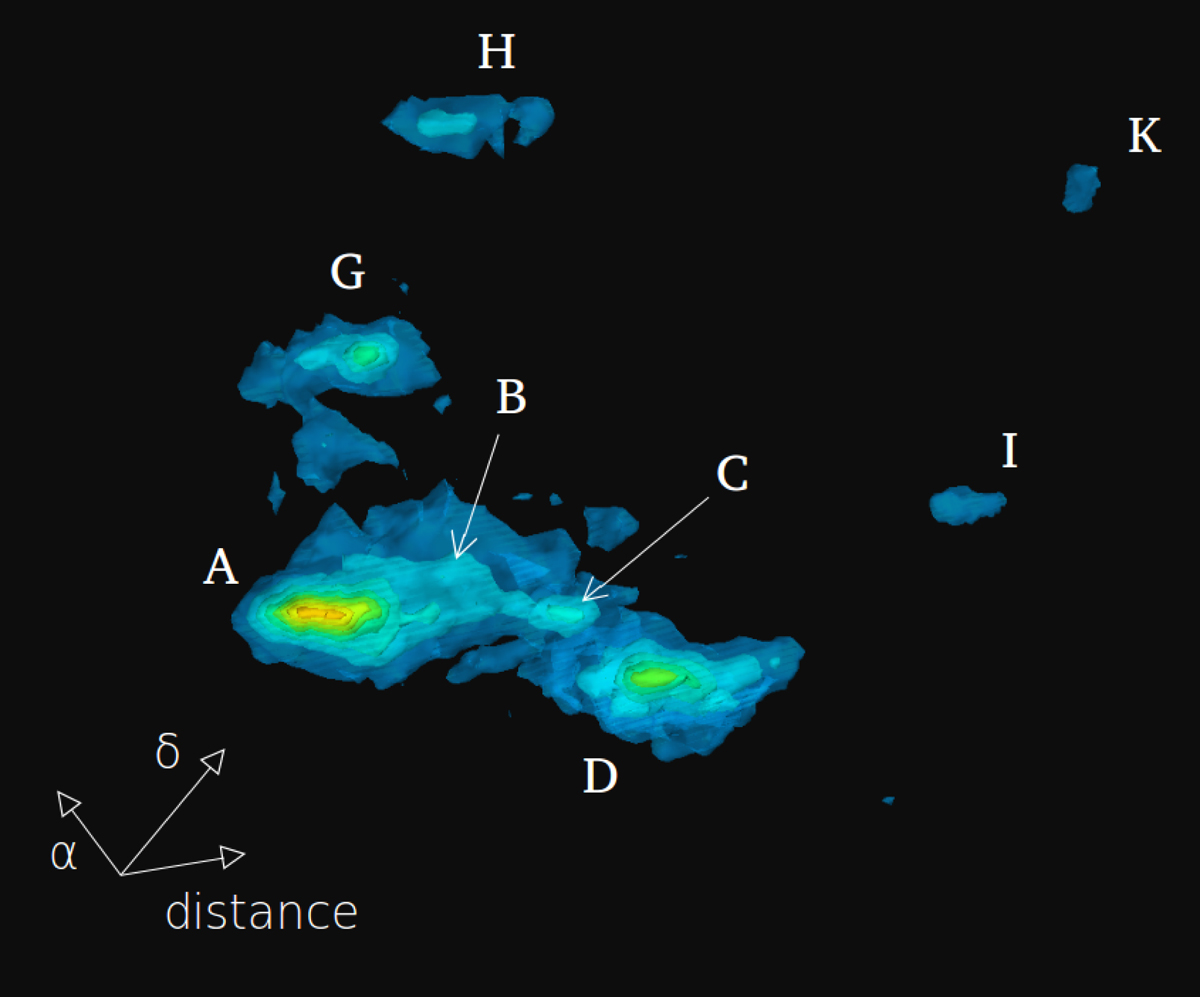
Isosurfaces of the 3D density distributions of the stars shown in Fig. 3. The distribution was smoothed with a Gaussian kernel of radius 2 pc. The lower density level shown is 0.5 stars pc−3. Distance from us roughly increases from left to right. The α, δ, and distance arrows correspond to physical dimensions of 20 pc. Components E and J are too sparse to be visible with the adopted contour levels, and component F is behind A and B from this vantage point. The animated figure is available online.
Current usage metrics show cumulative count of Article Views (full-text article views including HTML views, PDF and ePub downloads, according to the available data) and Abstracts Views on Vision4Press platform.
Data correspond to usage on the plateform after 2015. The current usage metrics is available 48-96 hours after online publication and is updated daily on week days.
Initial download of the metrics may take a while.