Fig. 5.
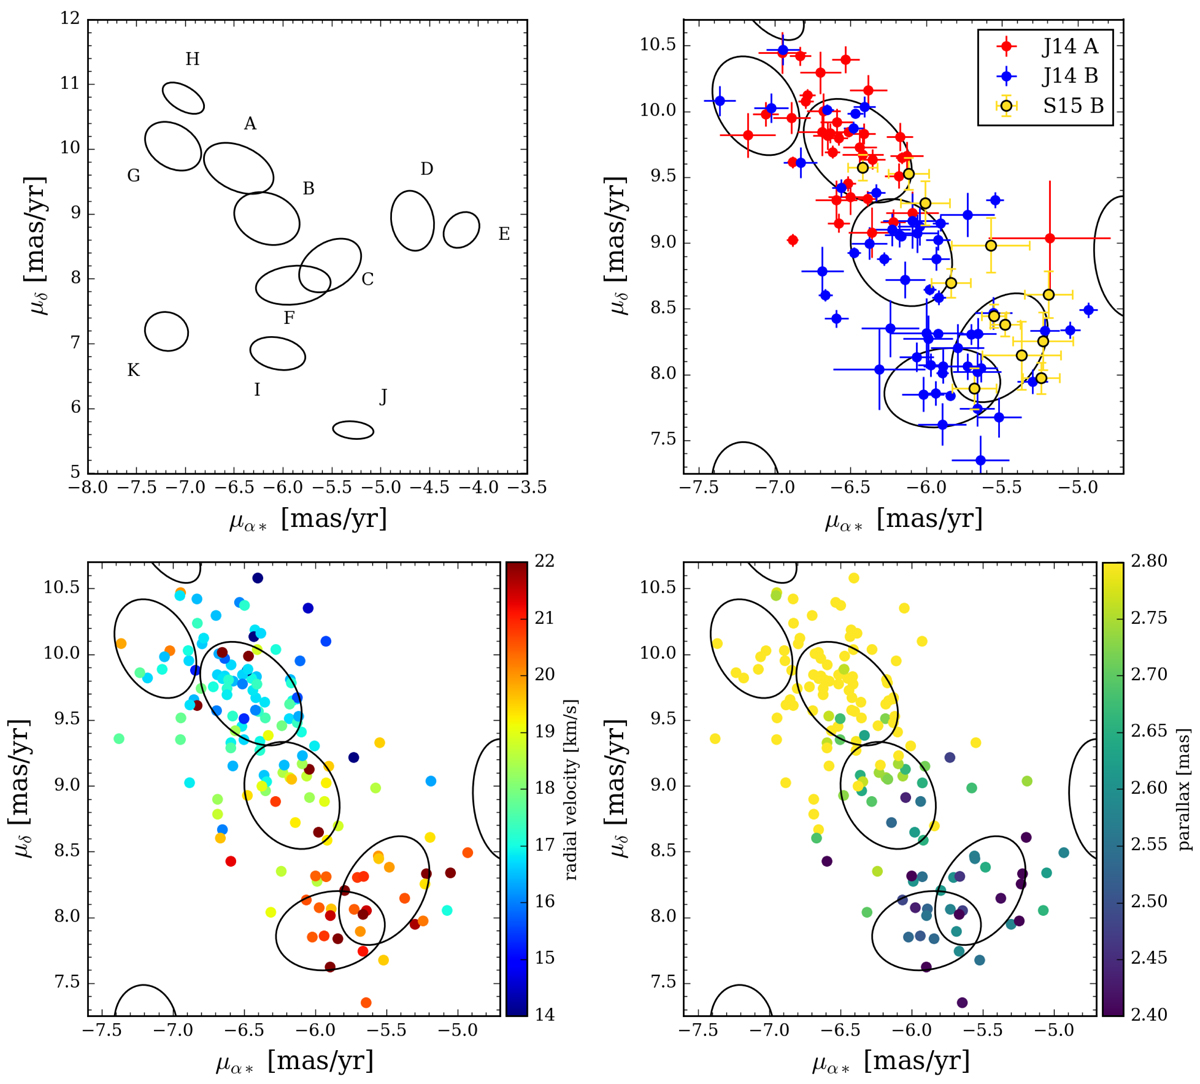
Top left panel: ellipses represent the mean and standard deviation of proper motions of the main components (as defined in Fig. 4). Top right panel: proper motions of the stars belonging to population A and B of J14 Jeffries et al. (2014; red and blue, respectively) and population B of Sacco et al. (2015; yellow). Bottom left panel: proper motions of all stars with radial velocities in J14 and S15, colour-coded by radial velocity. Bottom right panel: same as previous panel, colour-coded by Gaia DR2 parallax.
Current usage metrics show cumulative count of Article Views (full-text article views including HTML views, PDF and ePub downloads, according to the available data) and Abstracts Views on Vision4Press platform.
Data correspond to usage on the plateform after 2015. The current usage metrics is available 48-96 hours after online publication and is updated daily on week days.
Initial download of the metrics may take a while.