Fig. 4.
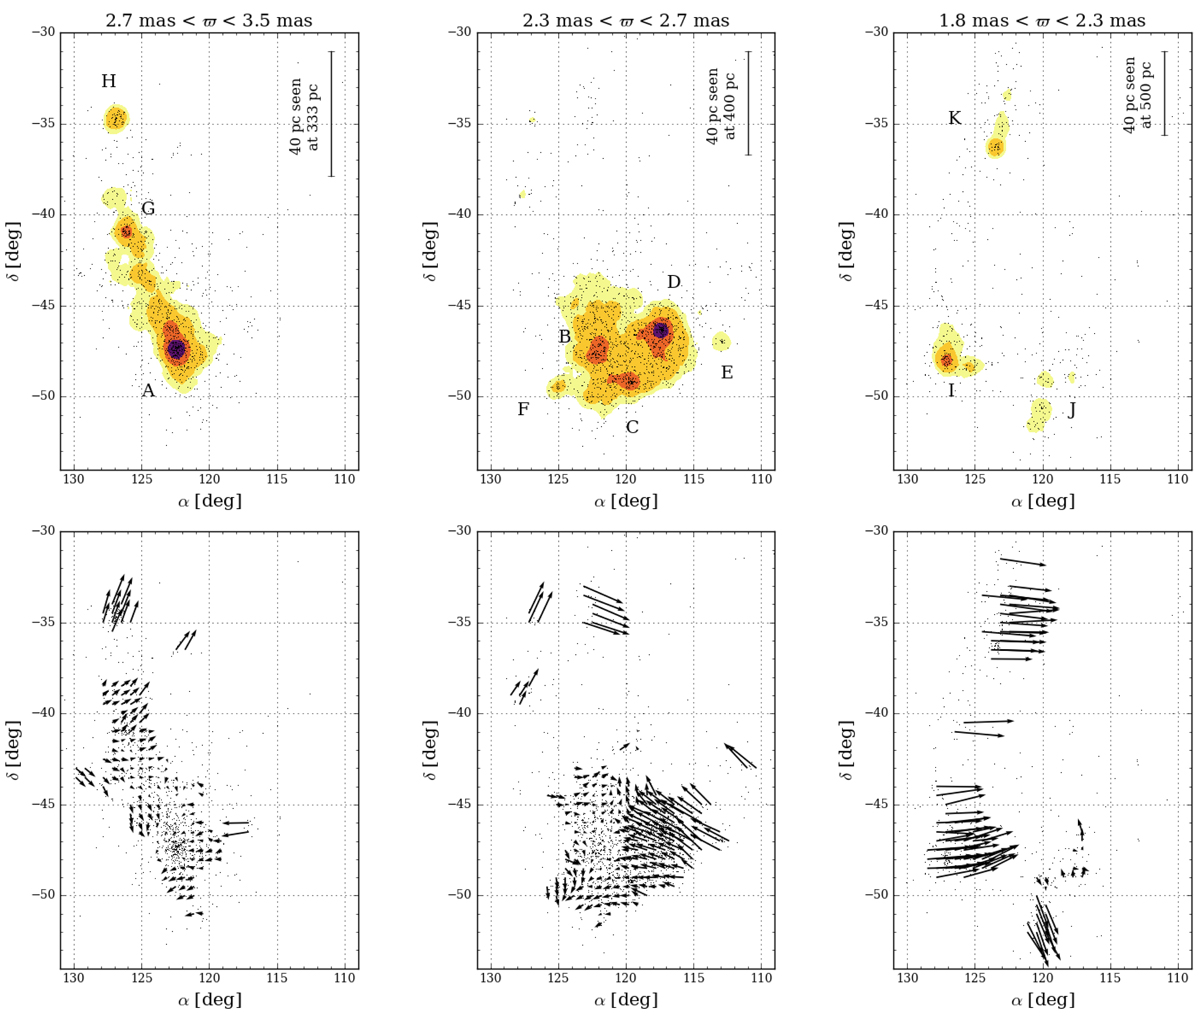
Top panels: spatial distribution of stars in three different parallax ranges, with contour levels showing local surface density in a 0.5° radius. Bottom panels: length and orientation of arrows indicate the mean tangential velocity (with respect to the main component A) in a 0.5° radius, if at least five stars are present within this radius.
Current usage metrics show cumulative count of Article Views (full-text article views including HTML views, PDF and ePub downloads, according to the available data) and Abstracts Views on Vision4Press platform.
Data correspond to usage on the plateform after 2015. The current usage metrics is available 48-96 hours after online publication and is updated daily on week days.
Initial download of the metrics may take a while.