Fig. 1.
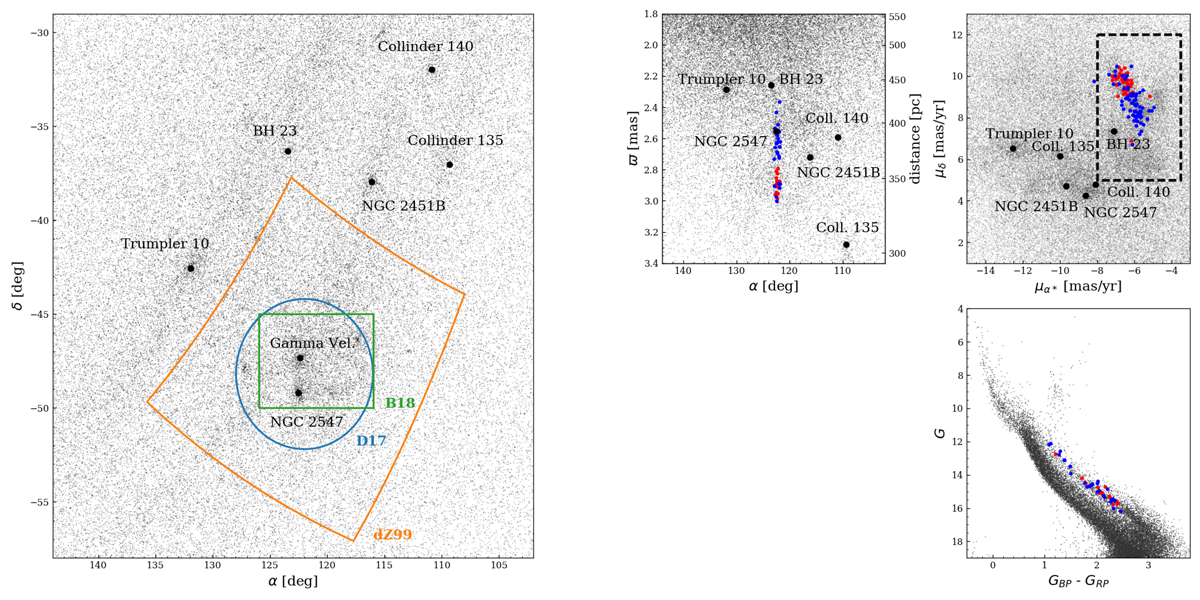
Left panel: spatial distribution of Gaia DR2 sources with parallaxes in the range 1.8 < ϖ < 3.4 mas. The black dots indicate known OCs in the area and distance range. We indicate the areas surveyed by dZ99 (de Zeeuw et al. 1999), D17 (Damiani et al. 2017), and B18 (Beccari et al. 2018). Top middle panel: α vs. ϖ. Top right panel: proper motion diagram for the same sources, indicating the mean proper motion of the known OCs (taken from Cantat-Gaudin et al. 2018a). The dashed box indicates our initial proper motion selection. Red and blue points respectively indicate populations A and B from Jeffries et al. (2014). Bottom right panel: colour-magnitude diagram of the stars that fall in the proper motion box defined in top right panel.
Current usage metrics show cumulative count of Article Views (full-text article views including HTML views, PDF and ePub downloads, according to the available data) and Abstracts Views on Vision4Press platform.
Data correspond to usage on the plateform after 2015. The current usage metrics is available 48-96 hours after online publication and is updated daily on week days.
Initial download of the metrics may take a while.