Fig. A.1
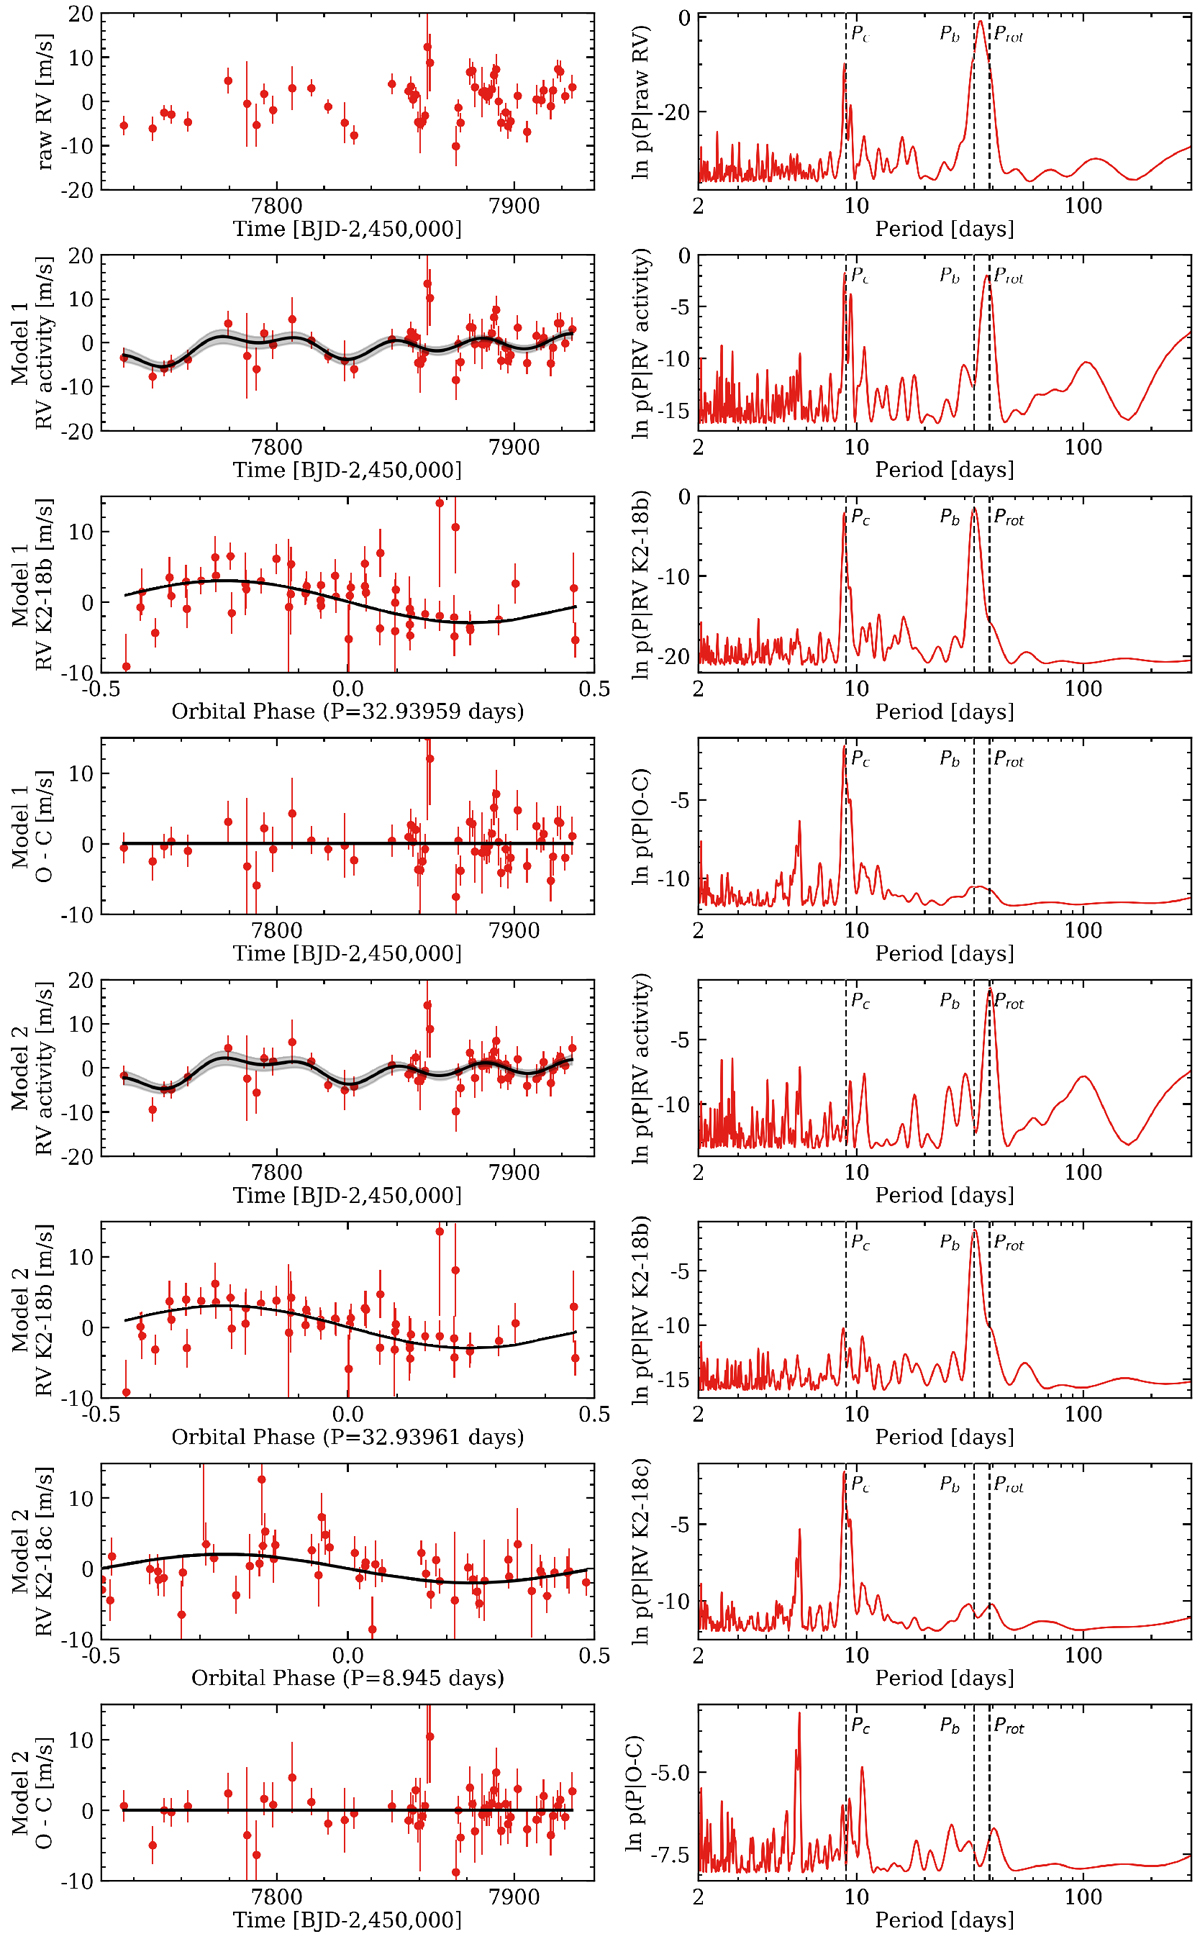
Results of our RV analysis of the 55 CARMENES RVs that are known not to significantly suppress the apparent 9-day signal seen with HARPS. The RV time-series and their corresponding GLSP are plotted in common rows for each coherent RV signal modelled (i.e. planets and stellar activity) in either a one- or two-planet model. The overplotted RV models are computed using the MAP model parameters from our MCMC analysis. The vertical dashed lines in the GLSPs are indicative of the MAP orbital periods for K2-18b and c and the photometric stellar rotation period. The first row depicts the raw RVs; the next three following rows present the results assuming a one-planet model (i.e. K2-18b); and the final four rows present the results assuming a two-planet model (i.e. K2-81b and c). The residual rms values assuming a one- and two-planet model are 3.84 and 3.57 m s−1, respectively. We find that the source of the residual ~5.5-day signal in thebottom GLSP is due to an alias rather than an unmodelled physical source (see text).
Current usage metrics show cumulative count of Article Views (full-text article views including HTML views, PDF and ePub downloads, according to the available data) and Abstracts Views on Vision4Press platform.
Data correspond to usage on the plateform after 2015. The current usage metrics is available 48-96 hours after online publication and is updated daily on week days.
Initial download of the metrics may take a while.