Fig. 6
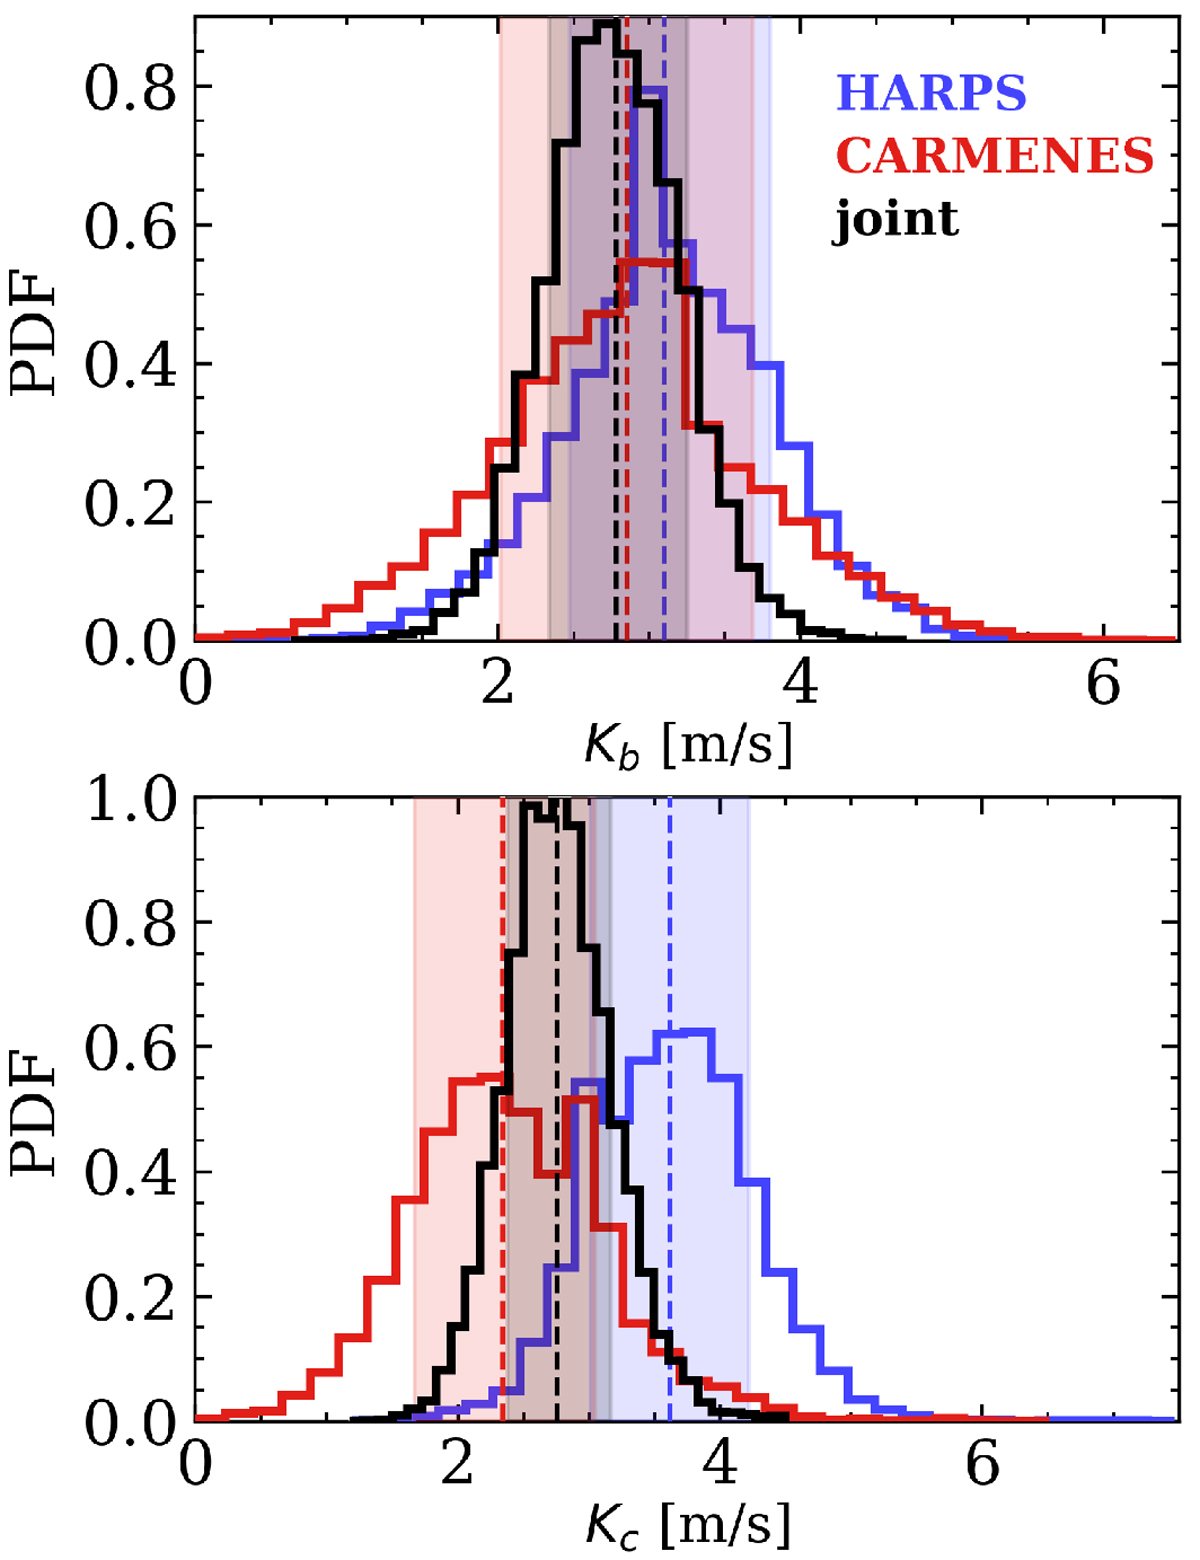
1D marginalized posterior PDFs of the K2-18b and c semi-amplitudes from analyses of the full HARPS (blue), the reduced CARMENES (red), and their joint (black) RV time-series. The dashed vertical lines and shaded regions depict the maximum a posteriori values and 1σ confidence intervals respectively. All Kb and Kc values are consistent at the 1σ level which is approximated by each PDF’s 16th and 84th percentiles.
Current usage metrics show cumulative count of Article Views (full-text article views including HTML views, PDF and ePub downloads, according to the available data) and Abstracts Views on Vision4Press platform.
Data correspond to usage on the plateform after 2015. The current usage metrics is available 48-96 hours after online publication and is updated daily on week days.
Initial download of the metrics may take a while.